GSoC Post 3
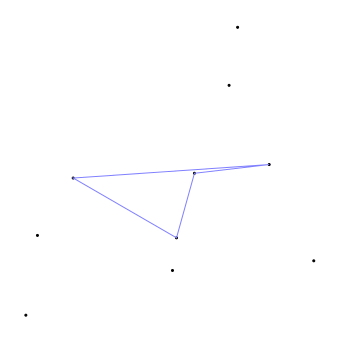
Hi! In my last post I mentioned that we would start calculating the distortions contained in the image. But we followed a different path! As the linear part was ready, we first worked on making some plots (scatter plots with side histograms of the difference in pixel scale of the celestial coordinates measured with the WCS we find and the celestial coordinates given as input) and drawing some quads to visualize it. This part was done using LaTeX and TikZ, a wonderful tool to produce graphics!

After that, we started to evaluate our results, and some changes were made: in statistics, for example, instead of getting direct the median, we use sigma clipping (a technique that removes outliers), allowing a better result. We also compared our results with one well established software: Astrometry.net. We’re getting pretty good results, but our running time was way bigger than the Astrometry.net one. So, we started working on that, and we have some ways to decrease our running time, such as making an only geo-hash search on the kdtree before the search containing the magnitude hashes. This reduces the dimentionality, which degrades the performance the higher it is. Other solution is to divide the celestial catalog in tiles, decreasing the number of total quads that we have to evaluate. Also, we can reduce the number of stars that we use to make quads. With these approaches, our running time got way better! 