Implementation of the Kurucz database to Radis
As planed in my last article, I started my project by adding a first database to Radis : Kurucz.
I based my work on a existing class developed in Exojax. I reviewed the associated methods that allowed to download the data from the database, store it in numpy arrays and extract the key information from it for further calculation.
By running a few examples on Exojax, I got familiar with the structure and nature of the data and key functions.
However, I noticed a problem in the install command of Radis’s sister code Exojax while running theses examples. After further investigation with my mentors and the Exojax team, it appeared to be a jax problem so we couldn’t fix it for the moment.
Since I could only make them work on a wsl environment, I couldn’t afford to import jax libraries used in the AdbKurucz database implemented to Exojax. This is the reason why I had to adapt the structure of the data and methods and stick to Pandas dataframes and numpy arrays.
First try : using a DatabaseManager structure
As a explained it in the previous article, Radis has developed a special Class the handle the database processes. Since Kurucz is an atomic Database, I tried to implement it by making it inherit from the DatabaseManager class and setting the molecule parameter to “None”. Unfortunately, it led to many exceptions in the methods that I gave up on this idea.
Second try : using Exojax methods without jax imports
This approach provided very nice results because the major part of the methods were already efficient.
Nevertheless I had some errors because of the data wasn’t loaded properly or syntax errors had broken a few parts of the code.
I finally managed to load, store and use the data from Kurucz.
Then I added an example to show how this new database can be used.
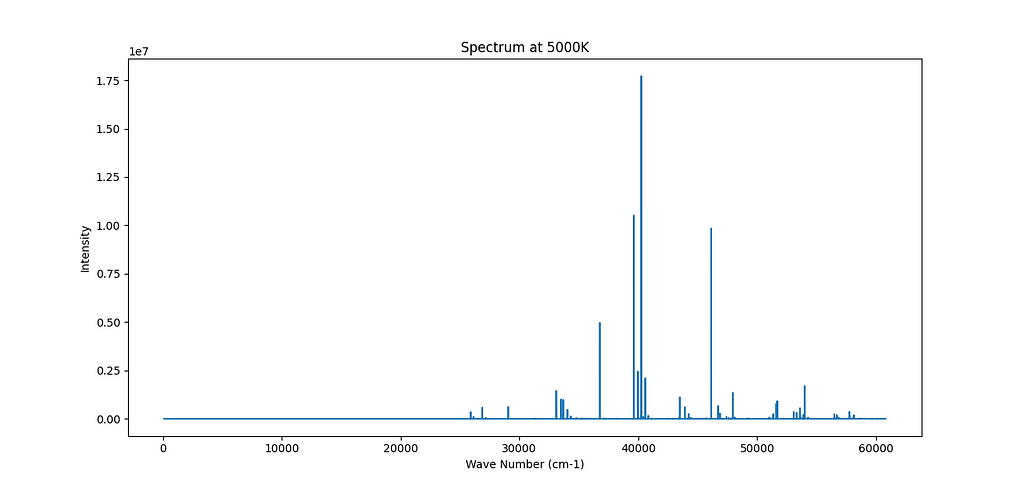
This is the first spectrum that I obtained from the Kurucz database for Fe.
A bit more explanations:
The population of the lower energy level of a given transition is the number of atoms that are in that energy state at any given time. So if you have a large population in a certain energy state, you have a lot of atoms that are able to make the transition and therefore emit a photon. Einstein’s coefficient A for a particular transition is a measure of the probability of that transition occurring. So if A is large, then each atom has a high chance of making the transition and emitting a photon. Thus, the intensity of the spectral line (i.e. the number of photons emitted per unit time) is proportional to both the population of the lower energy level (the number of atoms capable of making the transition) and to A (the probability that each atom actually makes the transition). So the intensity can be approximately represented as A * population.
The users can chose the temperature and the function then interpolates the values from the database and plots the spectrum.
In order to generalize this to all the atoms and ions of the database, I had to adjust the function load_pf_Barklem2016() from Exojax and fix an error in the way the partition functions were extracted.
Now I can load the data and use it properly. For Kurucz’s data, each file corresponds to a single species of atom only. For example, “gf2600.all” is dedicated to absorption lines of “neutral iron atoms”. The “26” is the atomic number of iron, followed by a “00” indicating zero ionization (=neutral; Fe I). For example, if you want to use spectral lines of singly-ionized sodium (Na II or Na+), you should download “gf1101.all”.
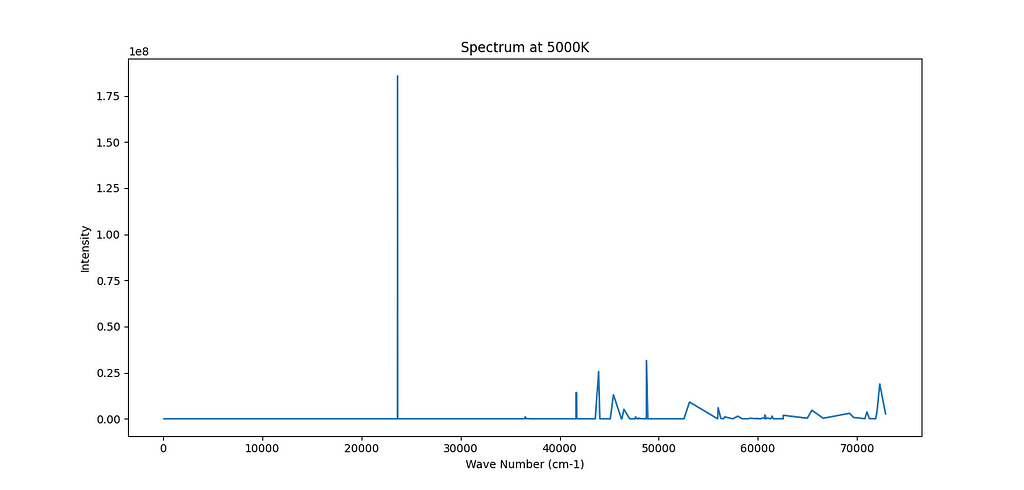
Here is another example for Ca.
What is next ?
I will end up this week by adding a few tests to ensure my code doesn’t break any part of the Radis architecture and may go for a PR in the next days.
Then the next step for Week 4 will be to implement the TheoReTS database to Radis .