Time to review my GSoC Project

With the end of the GSoC project, I will give this blog to summarise the JAX based optimization to analyze its applicability to enhance the loglikelihood calculation. The goal is to analyze, (i) the performance of different optimizers to evaluate the loglikelihood function, (ii) demonstrated the robustness of JAX to calculate gradients. And talk about the current code and corresponding improvement due to JAX.

The application of loglikelihood fitting to periodograms is discussed in [1]. Let us start with analyzing best-fit power spectrum (i) with different sets of optimizers namely: minimize(method=’Nelder-Mead’, ’Powell’, ’CG’, ’BFGS’, ’Newton-CG’, ’L-BFGS-B’, ’TNC’, ’COBYLA’, ’SLSQP’, ’trust-constr’, ’dogleg’, ’trust-ncg’, ’trust-krylov’, ’trust-exact’). The problem setting shifts the start and test parameters to study the graph of best fit optimizer using different “methods” listed above. First, we will stick with the Powell optimizer and try to check what is the current sensitivity of the implementation.

Currently, we seek to find a solution to the problem when the optimization algorithm often gets stuck in local minima, terminate without meeting its formal success criteria, or fails due to any contributing factor. Possible ways are: (1) add more Lorentzian components, (2) reduce the amplitude, (3) start the optimization process with parameters very far away from the true parameters, (4) experiment with the different optimizers/ “methods” to investigate if there is more superior algorithm compared to Powell.

Read more…

Ah, the end?

From when I’ve started writing these blog posts, I’ve taken quite a liking to writing these blog posts (except for the one fortnight I missed). OpenAstronomy has helped me improve the way I express myself in a satirical manner. I’ve spent quite a bit of time trying to figure out what’s the plan for my future but let’s save that story for another day.

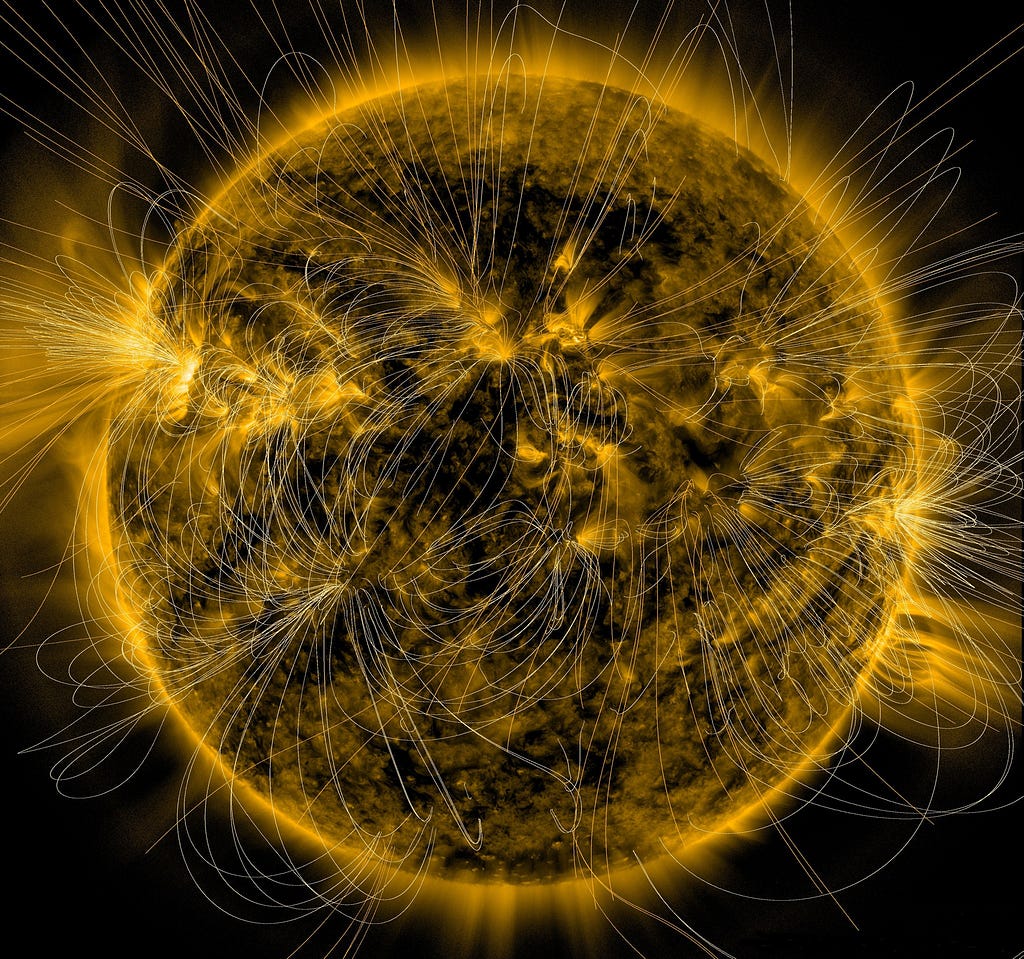
Here’s picture of sun and its field lines to show that I’m working on astronomy related, but actually have no proper knowledge of how any of this works, cheers! 🍻

Here’s a bit of how my last week of “officially” working on Sunkit-Pyvista went :-

  1. We put a pin on the animator as it didn’t make sense for us to work on something that isn’t of more value for the first release.
  2. Pfsspy field lines now allow for a custom color function to be passed while plotting.
  3. All main functionality is big-free (as far as I know) and can be used efficiently without having to worry about something failing.
  4. The final boss with our little project is trying to get the documentation to render 3D plots correctly and this is being handled by the mentors which is a huge load off my head.

That’s pretty much it I guess, these last few PRs mark the end of the so called “GSoC” period. What more have I left out? I’ve spoken about everything there is to be said, we’re nearing the end of this pretty interesting journey that I had embarked on. Other than a small bit of sadness, I’ve got nothing else to say. I’ve decided to continue working on Sunkit-Pyvista as being an open-sourced contributor is all about the community and I’m doing my part in working towards that (It’s not like I was planning on leaving either way though, this is almost a part of my daily routine).

Read more…

A Glimpse into my GSoC project

While all my blog posts till now were kind of abstract, here I will try to show some of the technical details of the project without making it too bloated. So as a one-line description, I had to study, implement and integrate a spectral estimation technique, namely the Multitaper Periodogram³ (and its derivatives¹), which are used to analyze astronomical time series.

Why spectral representations?

Before getting into the how of spectral analysis and its estimation, a brief sidenote on the why. Why do we even bother to study the spectral properties of a time series? It turns out, some of the determining characteristics or defining parameters associated with a certain time series are better brought out in their spectral representations (frequency domain representations).

As an example, the power spectral density is a common tool to try and unearth the periodic element(s) in a time series. Such spectral analysis techniques, at their core, are enabled by the Fourier Transform, and if you’d like to gain a better intuitive understanding of it, do check out this awesome video by Grant Sanderson on 3Blue1Brown.

Read more…

astropy@GSoC Blog Post #6, Week 8&9

Heads-up about the Progress of #11897

In summary the situation of the concerned PR a few days back was 4 types of CI test errors, one bug and possibly a need for modification of part of the code copied from pycdsreadme. All these have been taken care of as detailed below, but for the numpy depreciation warnings that keep coming up. I don't think we can do anything about the latter's persistence as of now. I shall comment more about it on GitHub as well.
  1. File not found error: Moritz's HW, i.e. using get_pkg_data_filename import, directly took care of this.
  2. Error in coord col decimal places: The precision of the coordinate component columns was getting set arbitrarily, which created difference in the output for 32-bit and 62-bit machines, and possibly between different operating systems. This has been corrected by having a fixed number of 12 digits after decimal for RAs, DEs and the latitude/longitude columns of Galactic and Ecliptic coords. This error also relates with the Formats bug.
  3. SphericalRepresentation col error: Now, this was a bit major issue compared to the two above, although the solution was only 2 line changes. When the coords cols were checked for and divided into components, the original SkyCoord col was deleted right within the loop. This made the iteration index of the loop to point to i+2 column after deletion, where i is the index of the original SkyCoord col. That is, effectively skipping the immediate next column after the SkyCoord col, as it would have receded by one place in the list. Got this fixed by popping the original SkyCoord col after all the columns in the table have been iterated over. This way all object type columns are converted to Column objects with str values.
  4. ~table.tests and test_write failures: All these errors were warnings due to depreciation of numpy specific aliases for different Python types. Most previous tests in Astropy appear to use these now depreciated numpy types, which raises warnings during testing our code. I have been able to provide remedy for majority of these by additionally using np.issubdtype(col.dtype, np.integer) while checking if the columns has integer values, however, tests with oldest supported version of all dependencies still fails. See my GitHub comment for more info.

The
formats bug

This was another major problem we had stumbled upon. It took me a while to skim through various docs and codes to find the optimum fix for this.

Our initial insight was that the difference between the Byte-By-Byte description and the data part of the written table, when the formats argument is passed to the write function, related in some manner to the string formatting part of the code. By first look itself, it was evident that there isn't any provision in the writer for cases when the columns already contain a format attribute, which is what is assigned when formats is passed, as I had written here back then. Creating allowance for this was easy enough, right away correcting the test outputs. Now, both the Byte-By-Byte and the table data had the number of decimal digits, or whatever other format for that matter, we wanted them to have. Apart from the internally created coordinate component columns, for which the number of digits after decimal was fixed.

It is when we want to go a step further than this and wanna truncate or eradicate the string formatting part to obtain the column format, that we stumble upon a road block. There are two concerns,
  • If no formats argument is passed, col.format will be set to None.
  • Even if we already know the column format, say .5f, we still need to evaluate the maximum size of the value strings of the column in most cases, and do some formatting to have the format in CDS/MRT recommendation, Fx.5.
The column formats passed in the formats argument are set by using the in-build Python function format (https://docs.python.org/3/library/functions.html#format). For cases when no formats argument is passed, the default behavior when writing the table data, for instance in the FixedWidth writer is to set the column format to '' which is equivalent to saying val = str(val). (https://docs.astropy.org/en/stable/table/construct_table.html#table-format-string) FixedWidth uses the maximum length of these strings to get the column widths. So, there the string formatting part of the code is essential if we want to know the correct format for columns without string values.

However, there may be another solution to this that can be tried in the long-term. I was curious to know what other writers in Astropy did in such situations when the column format needs to be given explicitly in the header of the written table. There aren't extravagantly many such use cases, but the FITS standard tables do have format keywords in the header as serve the purpose well. So, looking over the Astropy FITS writer, I found the way in which it deals with the problem of assigning column formats is by separately defining all the formats that can be and then using a custom Column class which has some default format attributes. (See:
https://github.com/astropy/astropy/blob/main/astropy/io/fits/column.py). ASCII writers also have a custom Column class, but the attributes that it currently has are exceedingly lacking to be of any use to us now. (https://github.com/astropy/astropy/blob/79323de928e87827526ed8fce04986a5dd459794/astropy/io/ascii/core.py#L270) In the long-run, we could take motivation from the FITS writer and make changes herein.

Other updates

I have began to work on the other two branches for Time cols and MRT metadata resp and would have them done in some time.
On an unrelated note, I found that the test_cds_header_from_readme.py test file in astropy.io.ascii.tests contains some CDS reading tests. It was recently modified by the 11593 PR (https://github.com/astropy/astropy/pull/11593/files). I imagine that these tests can be incorporated within test_cds.py and then we won't perhaps have to move CDS/MRT tests to any other test file?

Read more…
GSoC update!

GSoC started four months ago and it is not just about knowing more about the open-source that made the experience great! My mentors made it way cooler than I thought it would be. I was writing my Master thesis, for the last three months and surely, it has been a super productive summer for me! The best part is I get to do things at my own pace. My project particularly hasn’t been very easy to implement. I need to bridge a Machine Learning algorithm in the existing codebase. The fun part is venturing with different notebooks and figuring out with intuition, what could be efficient in terms of computational time, efficiency, cost etc. But as of now, the struggle has been to define the problem as exactly to achieve the result. But I will keep working on finding a solution with my mentor Daniela, and trust that struggle will bring some positive construction in Stingray.

The current data fit for the evaluation of likelihood happens using scipy.optimize.minimize function. However, there exists numerous ways to do this. SciPy optimize provides functions for minimizing (or maximizing) objective functions, possibly subject to constraints. It includes solvers for nonlinear problems (with support for both local and global optimization algorithms), linear programming, constrained and nonlinear least-squares, root finding, and curve fitting. The problem with the current minimization algorithm is that it converges at local minimum instead of global, i.e. it is not very robust. Recently, Machine Learning has evident development in such optimization tools. The strategy for ahead is that I will work on finding alternatives that potentially accelerate the code, makes it robust.

Read more…

GSoC - 3

Hello and welcome to the first blog of GSoC phase-2. Ever faced a time when there was way too much on the plate and you find it really hard to catch up on all the work? That is pretty much how the previous two weeks were for me. With the start of the oncampus internship drive, I was finding it really hard to give manage the project. Somehow I was able to make some progress but I am yet to complete the task.

I am basically trying to parse the .bz2 files of HITEMP databases into HDF5 files in a Vaex friendly format. Currently .bz2 files are parsed into HDF5 files with the help of high level pandas functions. But as we already know pandas can be very memory consuming. So, I am trying to write to HDF5 files with h5py library and produce HDF5 files that are vaex friendly (column based).

In order to do this, I am first converting bz2 files to .csv upon download -> mapping the datatypes of each of the columns -> writing to a HDF5 file with h5py. I am currently stuck at mapping the datatypes and also trying to make optimizations with respect to the chunksize.

Read more…

About my Google Summer of Code Project: Part 3

First and foremost, I celebrate the merging of the PR that brings reproject to NDCube! It defines a base-level functionality or MVP if you want to call it that, along with some relevant documentation. We also mark the release of ndcube’s 2.0 RC1. This is an important milestone since ndcube 2.0 brings significant changes, owing to the implementation of the new high-level WCS API.

Our next plan of action was to extend the method to use other algorithms that reproject supports. Interpolation (the one that the above PR implements) supports multi-dimensional cubes but “adaptive” and “exact” algorithms do not. For the time being, they only work on 2D cubes containing celestial axes. So that’s what I’ve implemented them for in a new PR, which is currently under review and should hopefully get merged soon.

The only problem for this PR was identifying celestial axes. We’ve taken a shortcut to solve this quickly and avoid creating a blocker, but a better implementation is due.

Read more…

Chapter 4: The Other Side

A new month has started and I have started to see the light at the end of the tunnel. Good Morning and welcome back. Phase 2 has been rolling and let us look at the new findings.

Earlier the complexity of Legacy method was determined. The complexity of LDM Voigt and LDM FFT was to be determined using similar approach. Upon executing several benchmarks based on Number of lines, Spectum range, wstep, broadening max width. Previously it was thought the complexity was:

time(LDM_fft) ~ c2*Nlines + c3*(N_G*N_L + 1)*N_v*log(N_v) (where N_v =  Spectral Points)

Read more…