GSoC 2020: glue-solar project 1.1
The official coding period of GSoC 2020 has begun on June 2nd (HKT) and the glue-solar work is currently underway according to plan as discussed with mentors Stuart Mumford and Nabil Freij during the community bonding period that precedes the coding period. The tasks proposed that we would like to see implemented this summer include but not limited to the following:
1. Modify the existing glue 1D Profile viewer to provide sliders for extra dimensions (currently collapses)
2. Clean up UX / UI (icon) for the pixel extraction tool (perhaps also upstreaming from glue-solar to glue)
3. WCS info for derived datasets (i.e. raster + SJI time linking)
4. Loaders for specific instruments: NDData (in glue), NDCube (for NDCube 2.0 with extra coords), SST, IRIS, EIS, DKIST (e.g. with asdf to glue)
5. Add auto-linking to match wavelength and time dimensions in larger cubes (currently already works for Celestial dimensions)
6. Enable image / Movie exports, both with axes and without axes via the matplotlib package
7. Add support for pre-computed statistics in datasets / viewers
The above, along with the accompanying documentation, are expected to be part of the deliverables of the GSoC project. So far a couple of pull requests (PRs) have been submitted to both the glue and glue-solar repositories (repos), with the most recent one being the one for updating the 1D Profile viewer to plot with wcsaxes instead, which can be accessed at glue-viz/glue's PR #2156. However, the CI problem encountered in this PR seems to be able to be fixed by upstreaming the pixel extraction tool which currently only resides in glue-solar. This will need to be discussed with my mentors as careful considerations such as one pertaining to timing are warranted.
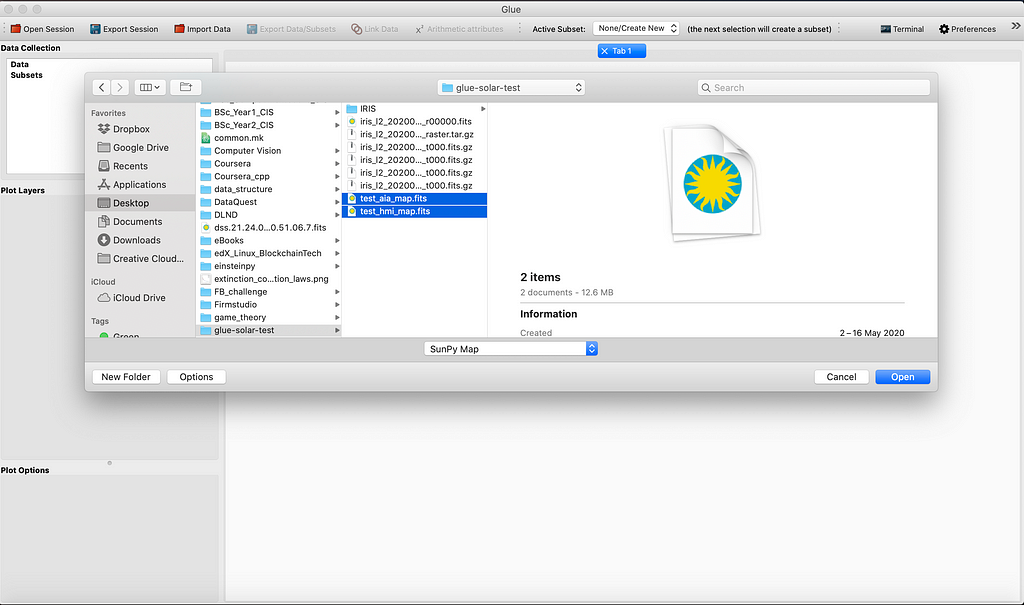
One of the first glue-solar PRs I have worked on are for adding an “open with SunPy Map” option to the “Import Data” tool. Part of this tool has been merged into glue-solar, while the other part is pending merge in glue. Basically if I load in an AIA map with its associated HMI map, like the sample one from SunPy, while choosing “SunPy Map” as opposed to the FITS format that gets detected by default, as shown in the Fig. 1:
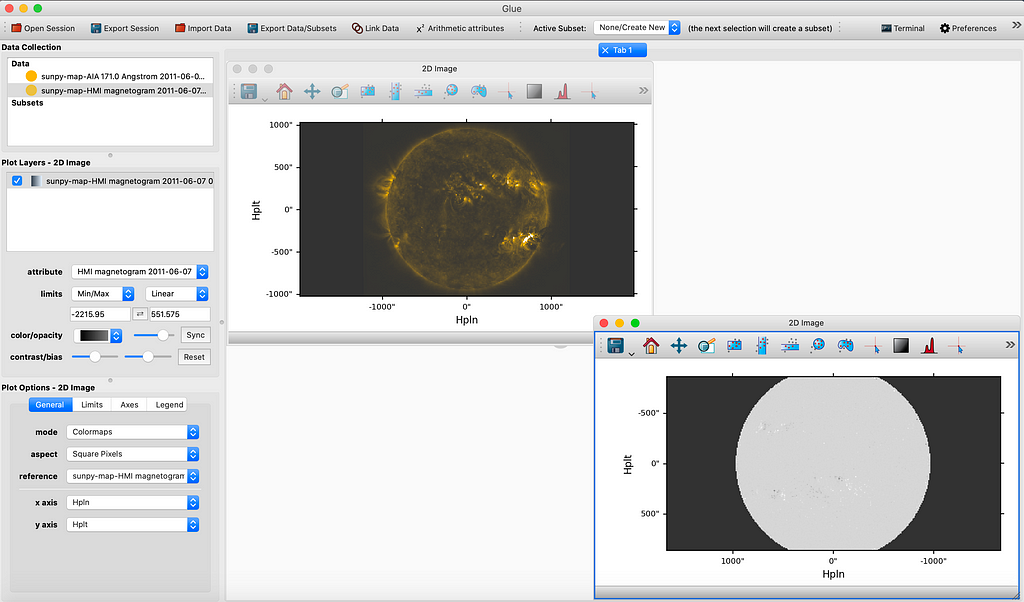
So if one plots the SunPy maps individually, one would get the what is shown in Fig. 2. This is basically the same as what one would get with FITS files as well, except for the colormaps.
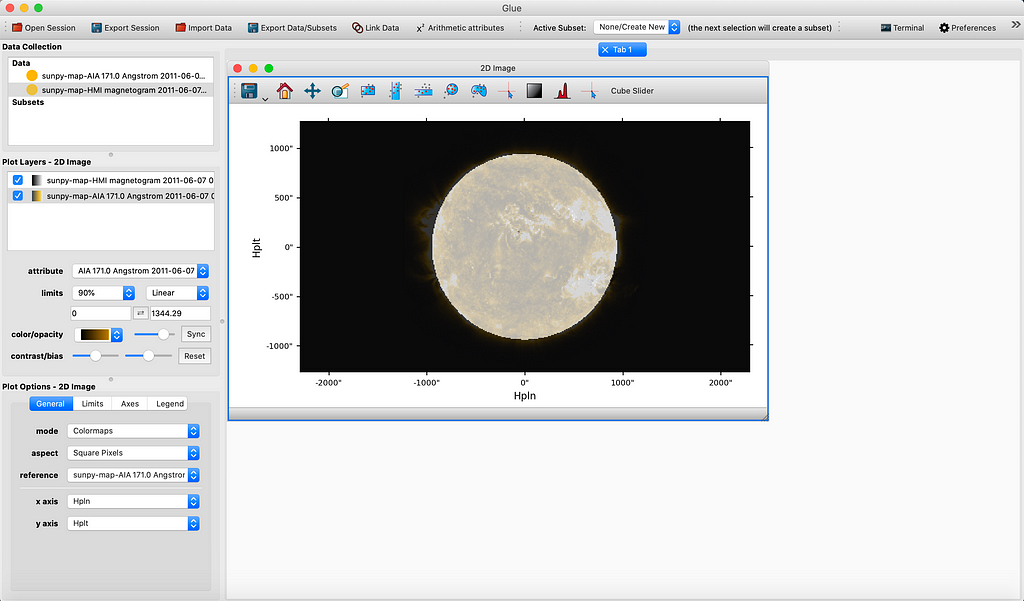
The magic of our work is that now with the glue-solar plugin, we can overplot AIA map and its associated HMI map, as simply as dragging the HMI data from the Data section onto the AIA map 2D image already opened with the 2D Image viewer, as these are spatially linked by the plugin using some pixel-to-pixel transformation via WCS.
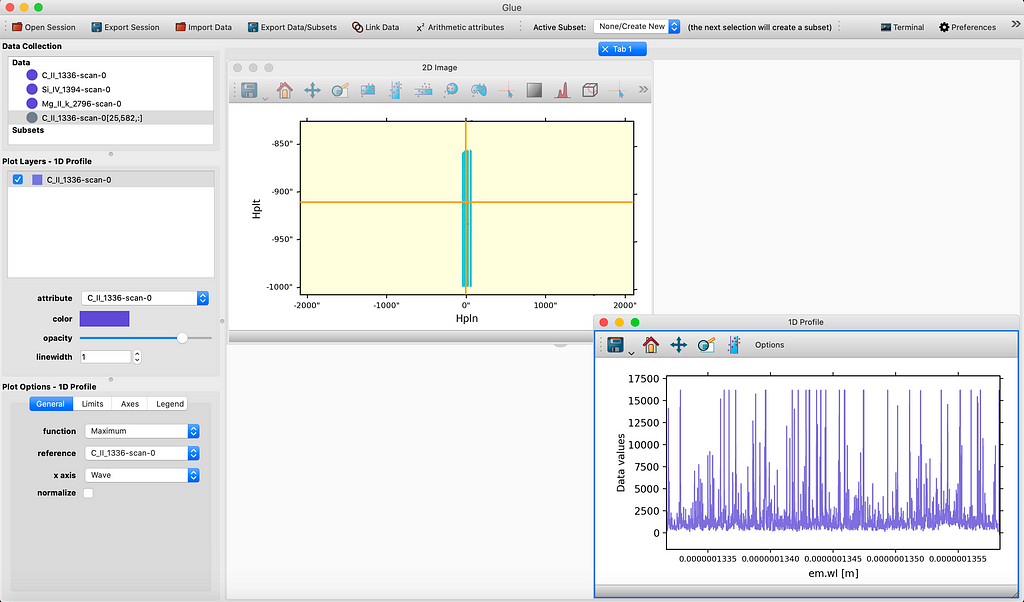
So the subject of attention that has been the focus of my glue-solar work, or my favorite “toy”, over the last few weeks has been firstly a prototype for a “SunPy 1D Profile” tool which plots a 1D spectrum at a spatial position as picked out by the pixel extraction tool currently resides within glue-solar. To upstream the changes I have made to glue, and with the help of my mentors especially Stuart, we have started work on a PR to move such changes to the “1D Profile” in glue proper, using my “SunPy 1D Profile” work as a check and basis. If one loads in a raster cube using some IRIS level 2 data using the IRIS Spectrograph file type enabled by glue-solar, plots a slice of the data cube with the “2D Image” viewer, and then extracts a pixel position in the 2D image in the viewer (with the “HPLN” as the x-axis in lieu of the “wavelength” as the default option), one obtains a 1D profile upon hitting the spectrum icon in the 2D Image viewer panel. The result is as depicted in the collapsing “Fig. 4” image below:
After which if one changes the “function” in the “Plot Options — 1D Profile” from the “maximum” to the newly added “slice” option in my PR, one would obtain a 1D spectrum without any collapsing as shown in the “Fig. 5” image below:
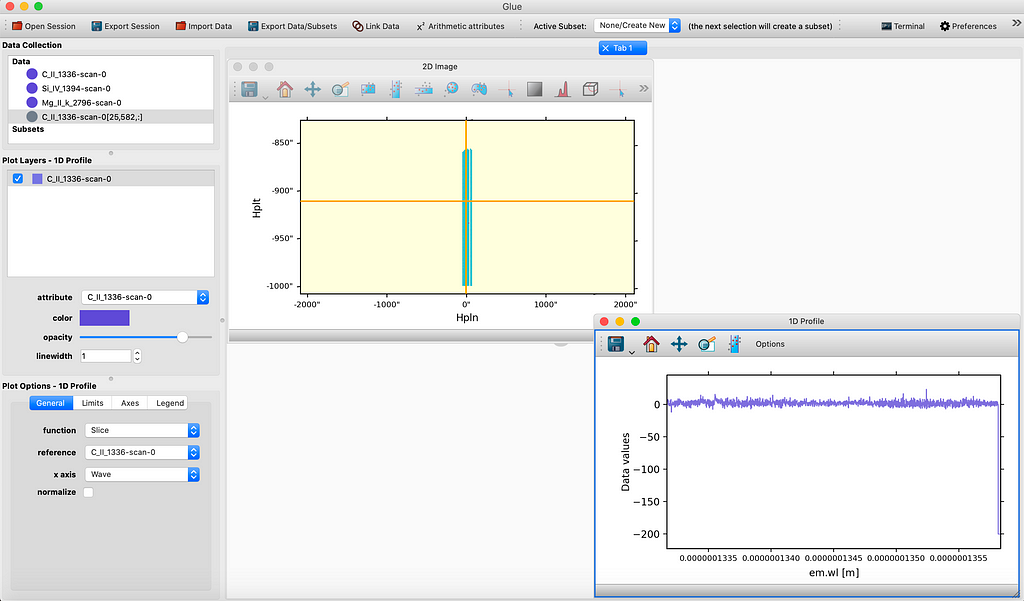
This non-collapsing 1D spectrum plotting facility is new to glue with the glue-solar plugin, and is currently still under heavy development.
Overall it has been a great experience this second time around participating in GSoC at this early phase. The experience is especially positive given that I am engaged in some work that I could understand and really like. Previously I have been exposed to data cubes in my PhD studies in astrophysics, with the knowledge gained now comes in handy for my glue and glue-solar work. I look forward to contributing as much as possible to the project in the months to come during GSoC, and possibly beyond.