Chapter 1: Apricity
An endeavour to better understand our Sun’s choleric disposition

ॐ भूर् भुवः स्वः।
तत्सवितुर्वरेण्यं भर्गो॑ देवस्य धीमहि।
धियो यो नः प्रचोदयात् ॥
There is some beauty in the fact that the essence of my undertaking needs not more than 24 letters of explanation.
What I have written above in the Devanagari script is one of the most important and highly revered Vedic hymns, the Gayatri Mantra. As translated by Dr S. Radhakrishnan, it states,
“We meditate on the effulgent glory of the divine Light; may he inspire our understanding.’’
The goal of my project is to study solar flares. The effulgent glory, the flares, that the divine Light, our Sun, produces. I shall meditate on them over the summer and better my understanding and appreciation of the mechanisms that govern them.
I shall also dare to predict them.
And there you have it,
Solar Weather Forecasting using linear algebra.
The Dataset
When thinking about flares, you may imagine something like this :
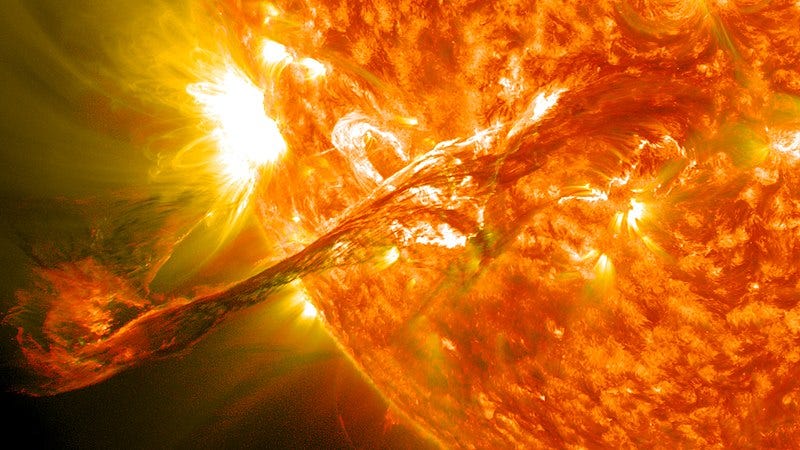
Flares indeed are mesmerizing.
To analyze the properties of flares, we must understand what flares are.
A solar flare occurs when magnetic energy that has built up in the solar atmosphere is suddenly released. Radiation is emitted across virtually the entire electromagnetic spectrum, from radio waves at the long wavelength end, through optical emission to x-rays and gamma rays at the short wavelength end. The amount of energy released is the equivalent of millions of 100-megaton hydrogen bombs exploding at the same time!
These flares emanate from active regions (ARs) in which high magnetic non-potentiality resides in a wide variety of forms.
Active regions on the Sun are places where the Sun’s magnetic field is disturbed. These regions frequently spawn various types of solar activity, including explosive “solar storms” such as solar flares and coronal mass ejections (CME).
What you see below, is a full disk Line of Sight (LOS) Magnetogram, which is an image of the sun’s magnetic field in the line of sight of the observer.
The data used in this project comes from Sunspotter, which is a dataset of such magnetograms with some measured properties for each Active Region.
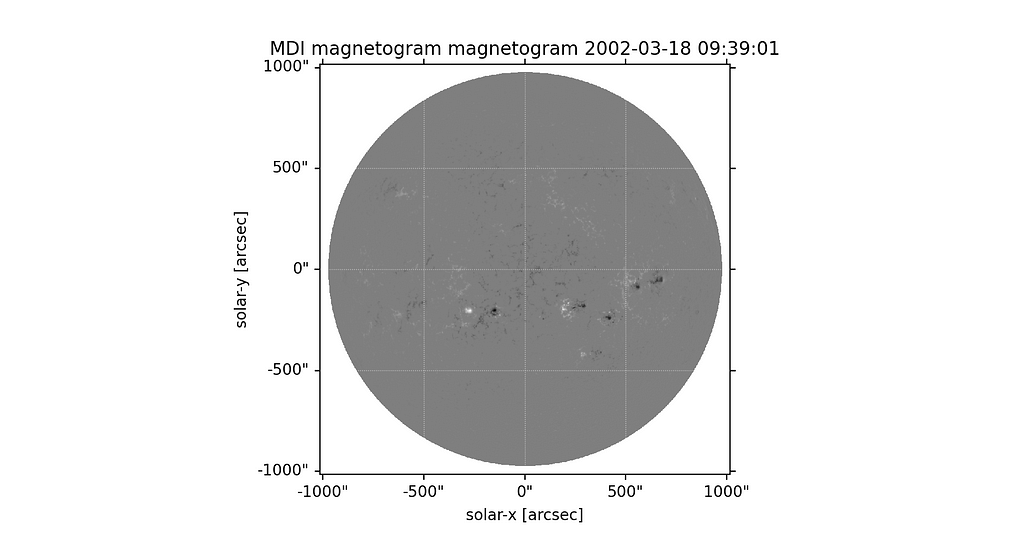
Sunspotter is a citizen science project that asked volunteers to classify solar active regions by their complexity — as it’s believed complexity has a direct relationship with their activity. With more than 25,000 volunteers and millions of classifications produced, we’ve got a very nice dataset. The images used come from the MDI instrument, which is onboard of SOHO — the NASA-ESA mission that’s been observing the sun for more than two decades.
All of the Active Region observations have a corresponding image, like the ones you see here.
The dataset is composed of five files:
- lookup_timesfits.csv: lists the filenames and the date of the data acquisition.
- lookup_properties.csv: lists the properties of the active region observed in each frame to be classified.
- classifications.csv: lists each classification made by the volunteers.
- rankings.csv: lists the final ranking on complexity.
The score provided on the rankings file follows the Elo rating system.
I have recreated the ELO rating algorithm in python, to reassign complexity score to the Active Regions. This gives us better control over the range of values, which in turn can be tuned to match the sensitivity of the forecasting model.
Apollo’s chosen one

Apollo, the Greek god of the Sun, was also the god of prophecies. It is said that when Apollo wished to speak to the mortals, he would speak through his chief priestess, the Oracle of Delphi. She, who alone could understand Apollo’s whims and fancies. The High priestess, Pythia.
In reverence, I have thus decided to name the repository that holds the code for this project, Pythia.
Pythia, for Solar Active Region Data Analysis.
Although we have just started, there is a lot you can do with Pythia already.
To install Pythia, for now, run the following command:
Some of the functionalities that Pythia offers, as of writing this post are:
Using Pythia, you can get the measured properties of any AR in the Sunspotter dataset. This is done using SunPy’s HEK module. This is the function description.
You can also download the full disk MDI magnetograms. This uses SunPy’s FIDO module to get the magnetogram as a FITS file. The following function returns an MDI map for a given observation date. Should the observation date not be in the Sunspotter dataset CSV files currently loaded in the Sunspotter object, the observation date nearest to the given observation date is used.
Should you wish for all the maps in a given range, you can use:
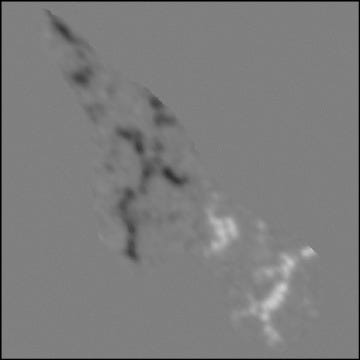
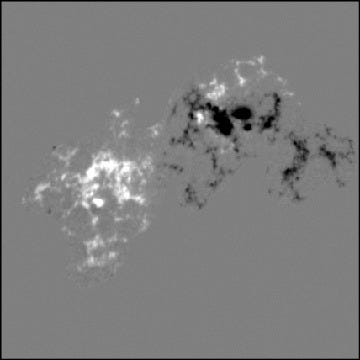
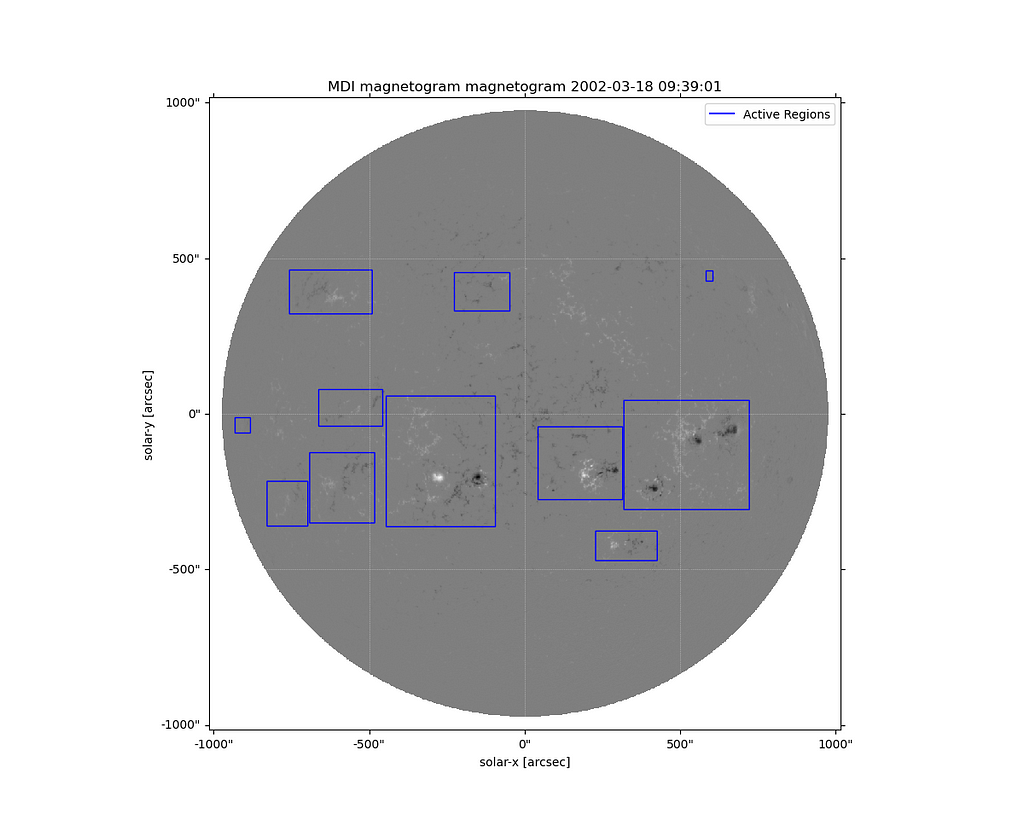
Finally, if you wish to plot all the ARs on a full disk magnetogram for which we have data, for any observation date,
Which, when used for observation date 2002–03–18 09:39:01 gets you the following plot. I have magnified it to highlight the fact that Active Regions come in all shapes and sizes.
What I have given is a brief introduction of the project, along with some code examples. Pythia is in active development and there are modules whichI have not mentioned here. I encourage my readers to install Pythia and play around with the code!
If you find any bugs or would like me to add any features, feel free to open an issue on the main repository.
My next post will be all about the Exploratory Data Analysis of the Sunspotter data, where we shall delve deep into the Sunspotter dataset.
Till then,
Divina Luceit Vos!
:)