GSoC 2020: glue-solar project 1.2
It has been a month since GSoC’s coding period started early in June 2020. Much has happened since then in the glue-solar project, and to sum it up I have been pretty much spending all my GSoC time working on a WCSAxes-enabled version the 1D Profile viewer for extracting 1D spectrum from data cubes using the pixel extracted in a 2D Image viewer. To be honest it has been very effort-intensive, though not necessarily time-intensive as I have previously feared. But the journey has been fun given my very supportive and friendly project mentors. To the layman and non-specialist what I have related regarding the project details probably sounds esoteric, which it is. With this realization I will split this and remaining GSoC blog posts into two halves: one pertaining to my personal struggles, and the other pertaining to the technical aspect of the work carried out thus far, in that order, so that that latter part can be conveniently skipped over (but I do encourage you to do read both sections in tandem so get a better understanding of the project :-p) Anyway, let me begin…
Part 1: Personal struggles
One personal “secret” I wish to reveal is that this is my last year as a PhD Candidate in Astrophysics at the University of Hong Kong (HKU). Not only that, since my Postgraduate Scholarship officially ran out in October 2019 and no other funding options are available, I have been holding down a job as a front-end developer for some parts of the weekdays to support my PhD studies. So far I have been trying to manage my time wisely and balancing my various duties and obligations as best as possible, but it has been a genuine struggle, especially in me trying to find enough time to sleep. To make matters worse I have a tendency to drift towards writing code than writing my thesis, though I am making progress in both. So I did hesitated to apply for GSoC for a 2nd time this year and was originally against the idea. But when I saw the project ideas available I changed my mind. Glue-solar is actually like a godsend for me; the project enabled me to not only further develop my self-discipline as a person, it also allowed me to learn from experts in the field working on open-source data visualization, and to grow from the experience. I thoroughly enjoyed interacted with my mentors, who have been very patient and helpful in offering me guidance (as well as friendship) throughout. If I have any advice I am allowed to offer anyone wanting to try out open-source software development through GSoC, and if GSoC does continue in the near future, I would recommend them to try out any of the OpenAstronomy projects. This is because OpenAstronomy is one (relatively) small but vibrant community of dedicated programmers, many of which scientists, that is welcoming to newcomers coming from a diverse background. And also, simply put, ASTRONOMY IS FUN! This is especially true for SunPy. I remember I started to contribute to open-source software as a relative novice with some bookish knowledge but not a lot of real-world experience back in around January 2019. My first contributions were to SunPy and Astropy. I remember I have read an article about how to get into GSoC in 2018 to learn about the program, though was not all that keen in getting into it at first. My first motivation to contribute was to give back to the community, because I had been using Python-based astronomy packages like Astropy for my PhD research. But at the urge of a mentor active in the Astropy community, I did apply. The GSoC project I worked on last year in 2019 was IRISpy, and my mentors were Dan Ryan and Laura Hayes. They were amazing as mentors, and were instrumental in my being able to complete the project successfully in the end of the program. I still miss my time spent with them on that project. IRISpy has officially changed its name to sunraster, which I was fortunate enough to help launch earlier this year in 2020. Basically when I was working on it as a GSoC project it was to provide additional functionalities for the analysis of observations from NASA’s Interface Region Imaging Spectrograph (IRIS) satellite which looks at UV emission from the solar chromosphere in particular. Now that scope has been extended to not just IRIS data, but data collected with similar instruments. This year I am using a lot of the code I have written for the IRISpy project for the current glue-solar project, which is kind of cool. As an icing to the cake, I get to work on data cubes for glue-solar, which is one of my favorite things in this world, a passion I have gained through my PhD research into integral field spectroscopy (IFS). For the present GSoC work I even get to work on 4D data cubes (ones with an extra time dimension), which has one more dimension than the IFS cubes I am so familiar with! So far it has been another incredible GSoC experience for me. All in all I have a feeling it will be a good one, and also a fruitful one.
Part 2: Technical aspect of progress made in glue-solar
So we (me and my mentors) have ventured away from focusing on glue-solar and have entered the glue “proper” territory as we put more time and effort towards modifying the 1D Profile viewer. By this I mean we have begun work on glue instead of glue-solar as was the case as described in my previous article where we have built a “SunPy Map” viewer. So I am well on my way to complete the task “modifying the existing glue 1D Profile viewer to provide sliders for extra dimensions (currently collapses)” soon, which is a significant part of the glue-solar project. Personally, I am really looking forward to working on the “adding support for pre-computed statistics in datasets / viewers” task, which I will surely make time to complete before end of August.
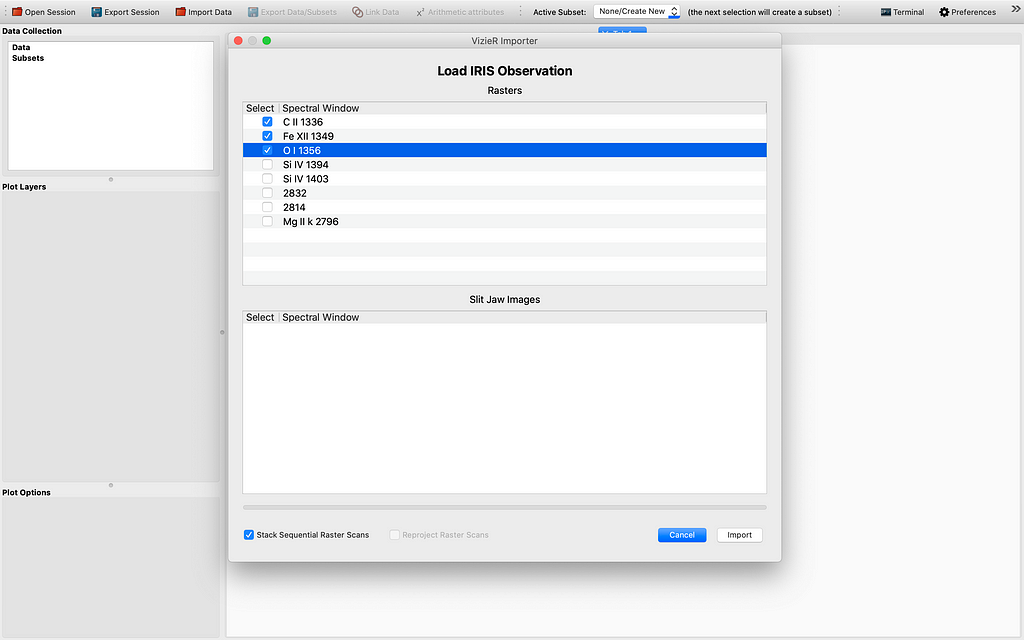
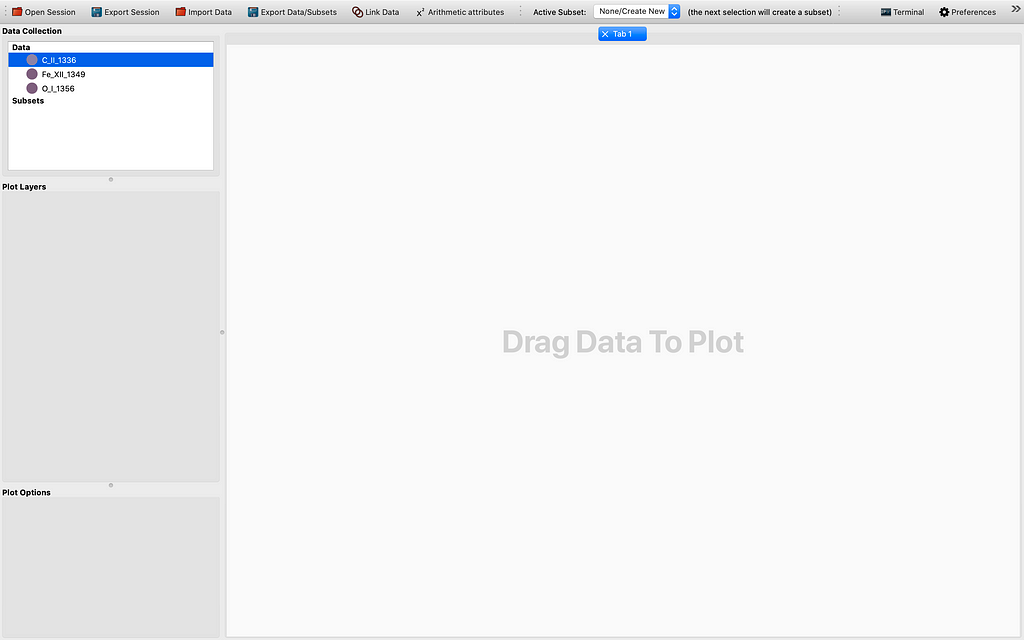
Let me demonstrate how far we have come with the modification of the 1D Profile viewer. So ordinarily it is hard to get 4D data cubes with a time dimension. This can be fixed by stacking sequential (IRIS) raster scans/cubes. After firing up glue from the terminal by the magic command “glue”, and importing some if not all raster scans from the same observation using the IRIS OBS directory importer, and choosing to “Stack the sequential raster scans” , we see some data points appearing in the Data field of the GUI. This is illustrated by the sequence of images to follow:
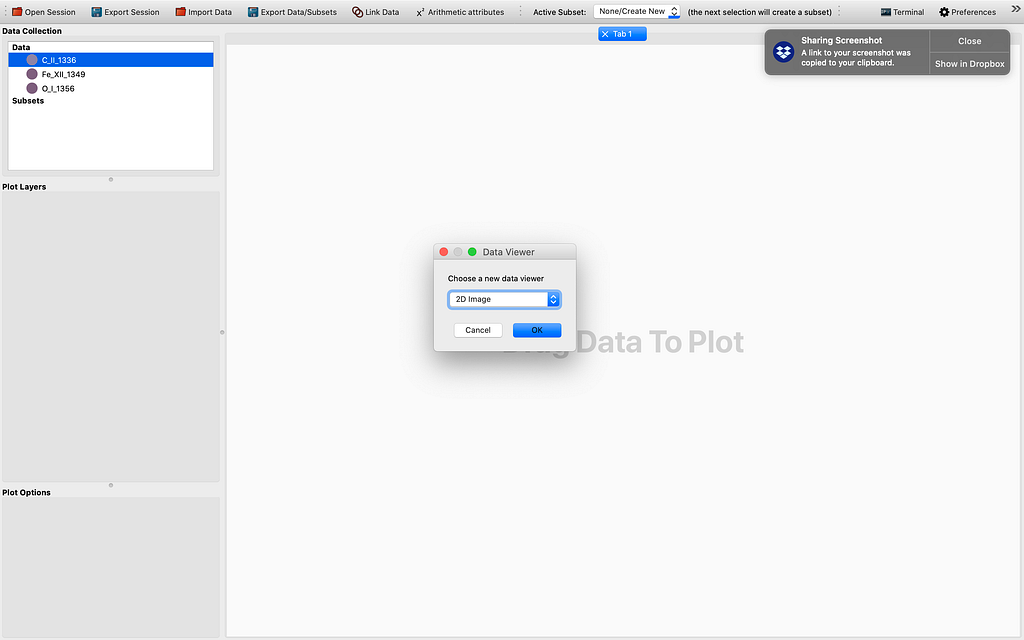
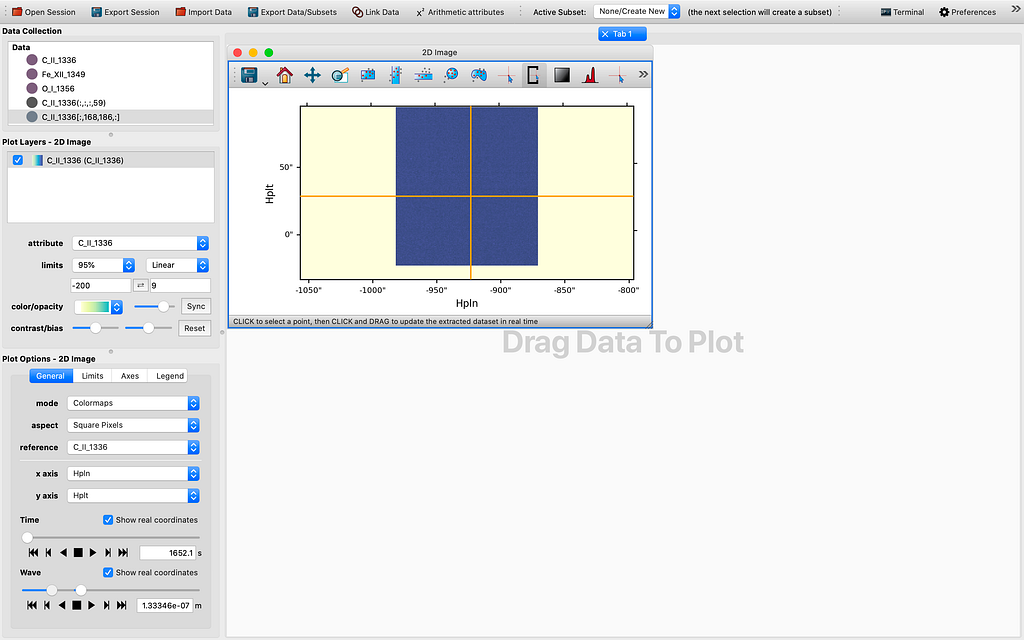
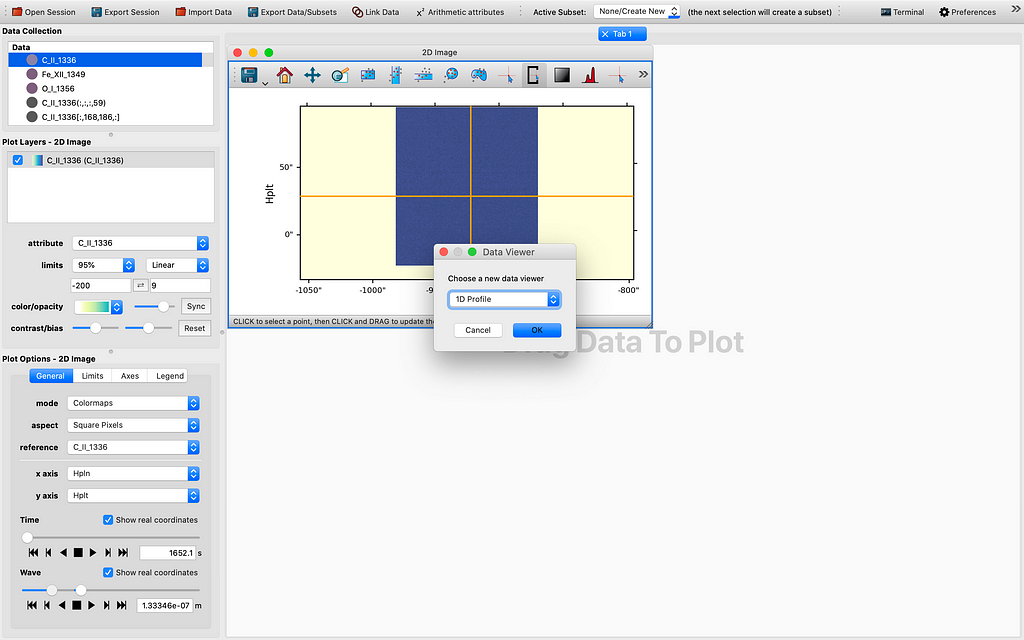
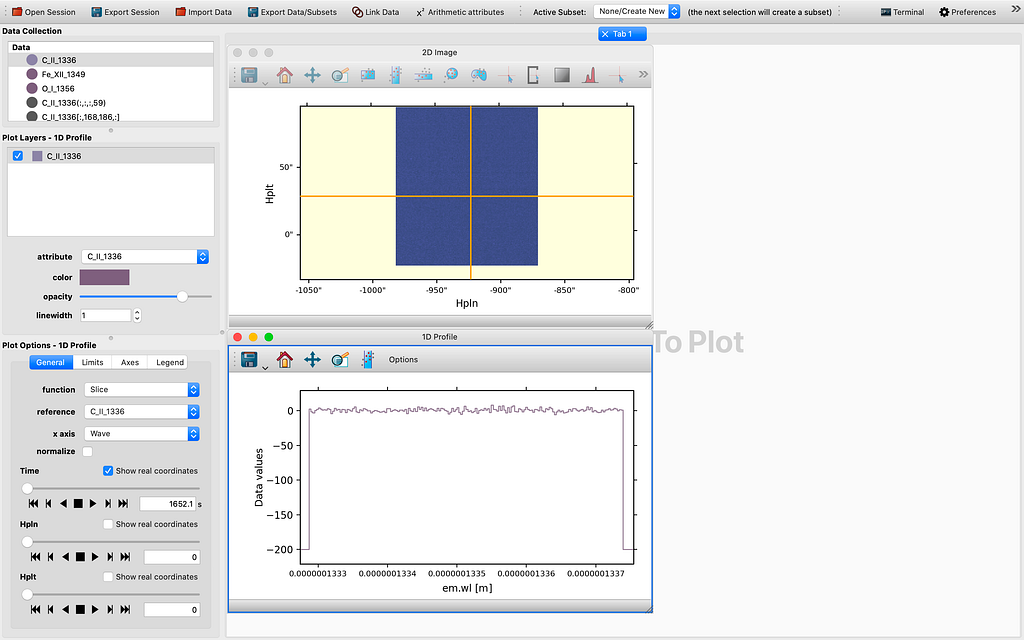
As we can see in Figure 6, all 4 dimensions are represented in the 1D Profile viewer either as the x-axis or as a slider quantity. In this example, the x-axis is indeed wavelength (which yields a 1D spectrum by definition), the other dimensions are time, longitude (HPLN), and latitude (HPLT). Even though for now the sliders are still not yet functional and will need some tender loving care to make them work in tandem with the reference data as inherited or passed from the 2D Image viewer, which may take a few more days to complete, I believe this is truly a milestone in this GSoC project. If we can control the sliders to change the coordinate values, that would be a very useful tool in data exploration. I will spare the perhaps rather dry details regarding the reasoning through the whole thinking process that leads to this check point. However, I would like to explain the logic used in the slicing. What I have done is to introduced a SlicedData class, much like the existing IndexedData class that is used for pixel extraction with a tool my mentor Stuart Mumford originally wrote for glue-solar (currently in a draft PR to be upstreamed to glue). First to pick a spatial coordinate, we choose in the 2D Image viewer the spatial axes for the image axes, selecting a point in the image shown on screen with the pixel selection tool, and then tweak the slider we would like its corresponding axis to be used as the x-axis in the 1D Profile viewer. Then we drag the same dataset to the viewing area and view using the 1D Profile viewer, in order to generate a profile for the slicing we have chosen. So this has been the work completed thus far. What is yet to be completed is to enable the manipulating of the 4D or higher dimensional data cube using the sliders for the same x-axis. So in the end regardless of the starting point, we could potentially use the 1D profile viewer to inspect the 4D or ND data cube in ways previously impossible before, at least to me.
Again, I would like to thank my mentors for their guidance and support which enabled the progress I have made to happen. Much work will need to be done in order for the PRs to be polished up and merged later on in the summer. I really enjoy my glue-solar work for GSoC this summer. I hope you enjoyed reading this article as much as I had fun writing it too!