Chapter 2: Inquisition
Does AR Complexity correlate to Flaring Activity?

There has never been a better time to help scientists understand the mysteries of the sun.
‘Sunspots’ and ‘solar storms’ are the feature of an ambitious project launched internationally by astrophysicists at Trinity College Dublin. Citizen scientists work as part of a global team to better understand sunspot and solar storm phenomena and their impacts on Earth. They do this by ‘rating’ the relative complexity of each sunspot image they see on the Sunspotter Web site, based on its size, shape and arrangement of ‘magnetic blobs’. Sunspotter is essentially a game of hot-or-not for sunspot data; citizen scientists are shown two images of sunspot groups and asked which is more complex. This is extremely useful in helping astronomers understand the physics of our star, the Sun.
Researchers cannot just use computers to classify all of this data because ‘complexity’ is not easily quantifiable.
This project is part of the ‘Zooniverse’, a Web portal devoted to citizen science projects and which has more than 1 million volunteers.
Now the question arises, does this complexity actually correlate to Flare Activity?
To find the answer, we must leverage the power of Statistical Hypothesis Testing.
Statistical Hypothesis Testing
A statistical hypothesis, sometimes called confirmatory data analysis, is a hypothesis that is testable on the basis of observing a process that is modeled via a set of random variables. A statistical hypothesis test is a method of statistical inference. Commonly, two statistical data sets are compared, or a data set obtained by sampling is compared against a synthetic data set from an idealized model. An alternative hypothesis is proposed for the statistical-relationship between the two data-sets, and is compared to an idealized null hypothesis that proposes no relationship between these two data-sets. This comparison is deemed statistically significant if the relationship between the data-sets would be an unlikely realization of the null hypothesis according to a threshold probability — the significance level. Hypothesis tests are used when determining what outcomes of a study would lead to a rejection of the null hypothesis for a pre-specified level of significance.
The Null Hypothesis
In inferential statistics, the null hypothesis is a general statement or default position that there is no relationship between two measured phenomena or no association among groups.
In other words nothing interesting is going on. The data on complexity has no relationship with the data on Flaring Activity.
Our primary work here is to find evidence against the Null Hypothesis.
The Alternative Hypothesis
In statistical hypothesis testing, the alternative hypothesis is a position that states something is happening, a new theory is preferred instead of an old one (null hypothesis).
For our present study, the alternative hypothesis states that there indeed is a positive correlation between AR complexity and Flaring Activity.
It is this hypothesis that gets proved if we can successfully disregard the Null Hypothesis
I take a statistical approach to determine if the complexity indeed does correlate to Solar Flare Activity.
p-Value
In statistical hypothesis testing, the p-value or probability value is the best probability of obtaining test results at least as extreme as the results actually observed, assuming that the null hypothesis is correct. A very small p-value means that the observed outcome is possible but not very likely under the null hypothesis, even under the best explanation which is possible under that hypothesis.
A smaller p-value would indicate that the Alternative Hypothesis is more likely than the Null Hypothesis. A small p-value is necessary but not sufficient to disregard the Null Hypothesis.
The task at hand, thus, is to find the correlation between the AR complexity and the Flaring Activity, should any exist, and to find the p-value for the correlation.
To calculate the correlation and the associated p-value,
Now that we have the DataFrames, we move on to use Point-Biserial Correlation.
Point-Biserial Correlation
A point-biserial correlation is used to measure the strength and direction of the association that exists between one continuous variable and one dichotomous variable. It is a special case of the Pearson’s product-moment correlation, which is applied when you have two continuous variables, whereas in this case one of the variables is measured on a dichotomous scale.
Assumptions for using Point-Biserial Correlation
Assumption 1
One of the two variables should be measured on a continuous scale. In this analysis, the Complexity is continuous.
Assumption 2
The other variable should be dichotomous. In this analysis, the whether an AR flares is dichotomous, 0 denoting no flaring and 1 denoting flaring.
Assumption 3
The continuous variable should have equal variances for each category of the dichotomous variable.
Assumption 4
There should be no outliers for the continuous variable for each category of the dichotomous variable.
Assumption 5
The continuous variable should be approximately normally distributed for each category of the dichotomous variable.
Having already satisfied assumptions 1 and 2,
For Assumption 3
Thus Assumption 3 holds.
Continuous variable in both positive and negative classes has equal variance.
For Assumption 4
This script gives the following two plots:
In both plots 1 denotes that a flare has been observed and 0 denotes no flaring activity is observed.
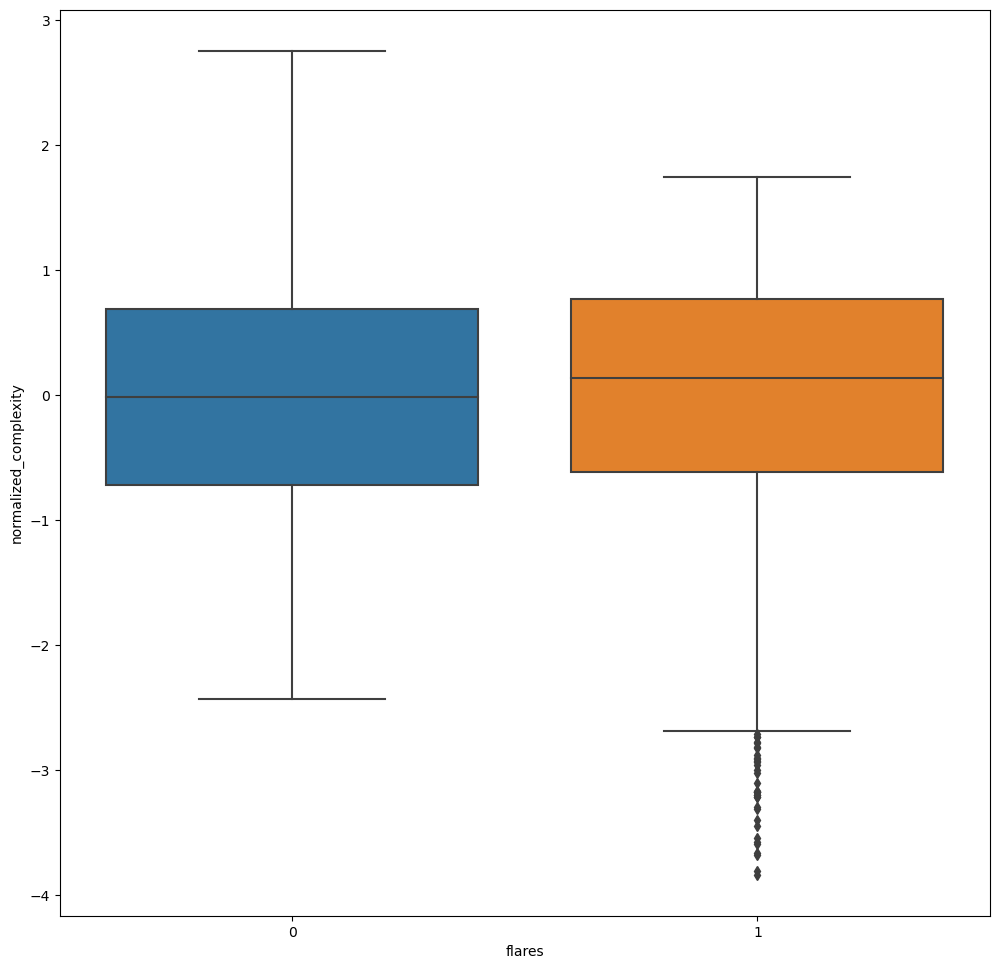
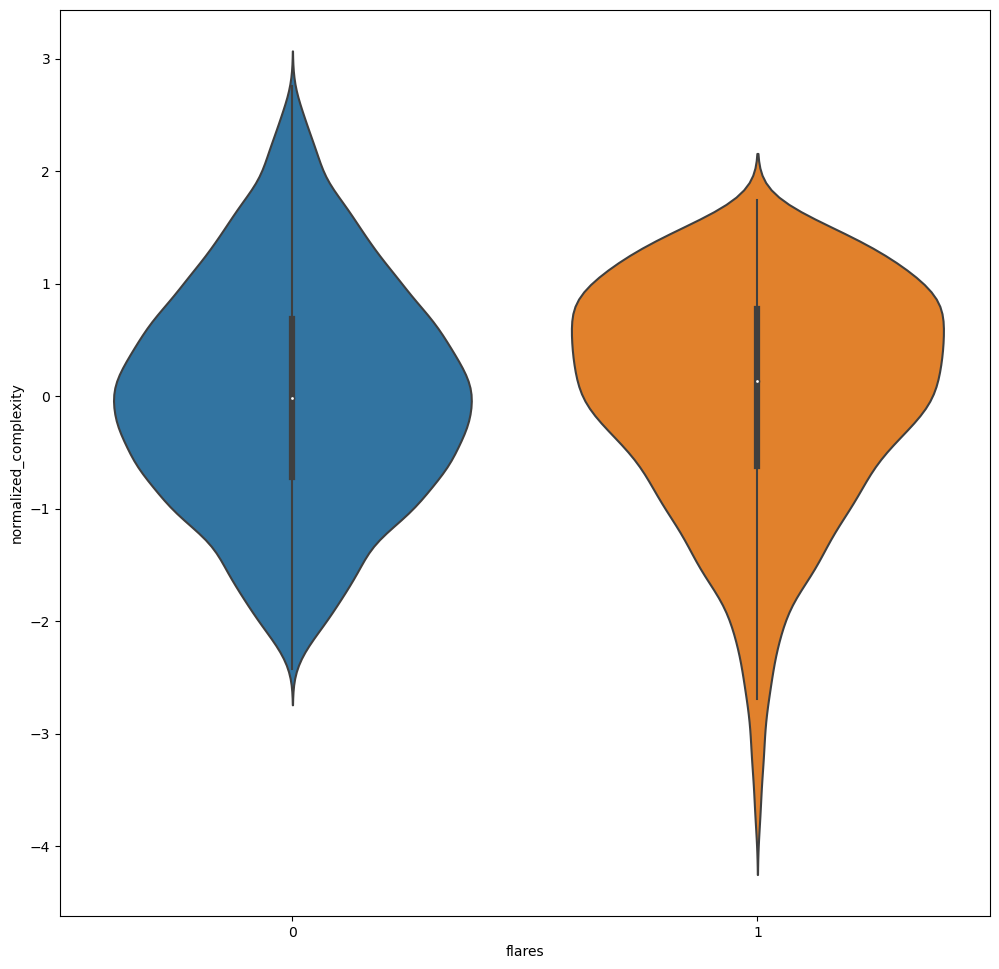
These plots show some outliers. For the current analysis, it is assumed that the outliers do not affect the correlation significantly. It is of interest to see the quantitative effect that the outliers have on the overall forecasting.
For Assumption 5
Plotting the distribution of positive and negative classes
Which gives,
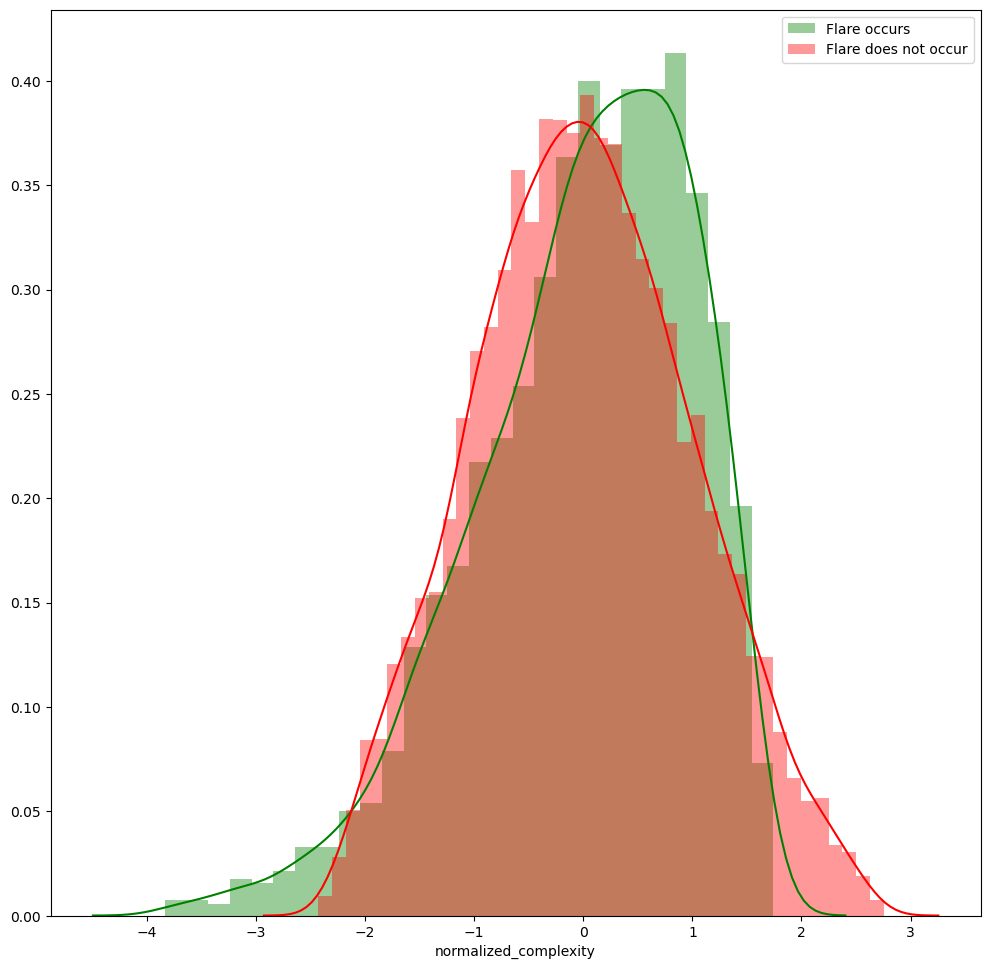
From the distribution plots, the distribution of the normalized complexity in the negative and positive classes can be considered Gaussian.
Thus Assumption 5 holds.
Point-Biserial Correlation
Since all the assumptions are satisfied, we move on to the actual correlation.
Thus,
The Point-Biserial Correlation shows a moderate positive correlation between AR complexity and Flare Production.
The moderate positive correlation of 0.45 indicates that there indeed exists a positive relationship between AR complexity and Flare activity.
Although the negligible p-value of 0.0 is necessary to disregard the the Null Hypothesis, it is not sufficient.
My mentors and I are devising a strategy to firmly establish the alternative hypothesis.
This post marks the end of the first month of my GSoC journey, and my oh my what a month it has been!
I am used to working long hours but somehow working on Pythia always makes these long hours pass me by in minutes.
July brings with it, Deep Learning. The next month will be the most fun as I get to play around with neural networks and actually work on forecasting flares!
I just hope the gods that govern CUDA and PyTorch are benevolent and do not curse me with exploding gradients.
:)
References :
1) On Sunspotter
3) Statistical Inference and related sub topics
Chapter 2: Inquisition was originally published in Noteworthy - The Journal Blog on Medium, where people are continuing the conversation by highlighting and responding to this story.