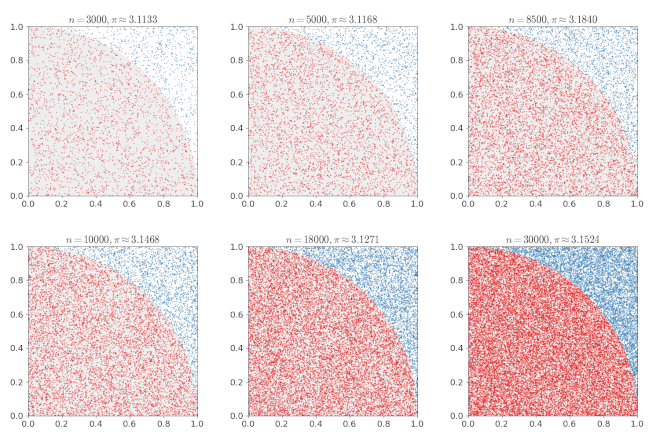
Monte Carlo approximation of pi
In this session you will be practicing a number of things you’ve learned over the last two days and seeing how you can combine those seemingly distinct concepts to solve a problem. First let’s discuss the problem we intend to solve.
Suppose we need to calculate the value of $\pi$ (it’s readily available in several libraries, but let’s assume for the purposes of this excercise that you need to calculate it anyway). The approach we’ll use for this is called a Monte Carlo method. For those unfamiliar with the term, Monte Carlo methods are a way to approximate values using random numbers which have some particular statistical properties relevant to the problem at hand.
This method consists of the following steps:
- Consider a unit square (x = [0, 1], y = [0, 1]) containing a quarter of a unit circle ($r = 1$)
- Randomly select a point within the square
- Determine whether the selected point is within the circle
-
As you select more points, the ratio of the number of points within the circle to the total number of points will converge towards $\pi / 4$, so

Challenge
- Here in the notebook, write a function that implements the algorithm described above and returns a value for $\pi$
- If it helps you to conceptualise the problem, loop over the number of points you want to use and do your calculations on each iteration
- Once you're happy with that, refactor your function so that it uses numpy operations and considers all the points at once, instead of looping over them
Challenge
-
Outside the notebook, in whatever text editor you're most comfortable using, make a Python script containing your $\pi$-calculation function, and save it in the same directory as this notebook. Import that function into the notebook and test it a bit. Make sure it still gives the correct answer and that you're happy using it as an imported function.
-
Write some tests for your function, in a separate test script. Run your tests and make sure that your function is definitely doing what you expect it to be doing.
Challenge
- In your script, make a plot like the one above showing the random coordinates used in your calculation and the answer those points produce.
- Try running your function with different numbers of iterations and making a plot to compare the different results this gives you.
If you get through all of the above tasks before the end of the session and want an additional challenge, try making an animated version of the plot above, which changes while the answer is being calculated and updates both the points and the title. We haven't covered how to make animations, so you'll have to look up how to do this using the matplotlib documentation other online resources, and ask one of the instructors if you get stuck.
