Interact
Objectives
- Create tables
- Access data in tables
- Combining tables
- Aggregation
- Masking
- Reading/writing
Documentation
For more information about the features presented below, you can read the
astropy.table docs.
Creating tables
Table length=3
| name | flux |
|---|
| str8 | float64 |
|---|
| source 1 | 1.2 |
| source 2 | 2.2 |
| source 3 | 3.1 |
Table length=3
| name | flux | size |
|---|
| str8 | float64 | int64 |
|---|
| source 1 | 1.2 | 1 |
| source 2 | 2.2 | 5 |
| source 3 | 3.1 | 4 |
<Column name='size' dtype='int64' length=3>
Row index=0
| name | flux | size |
|---|
| str8 | float64 | int64 |
|---|
| source 1 | 1.2 | 1 |
Units in tables
Table length=3
| name | flux | size |
|---|
| | cm |
|---|
| str8 | float64 | int64 |
|---|
| source 1 | 1.2 | 1 |
| source 2 | 2.2 | 5 |
| source 3 | 3.1 | 4 |
Some unitful operations will then work:
$[0.01,~0.05,~0.04] \; \mathrm{m}$
However, you may run into unexpected behavior, so if you are planning on using table columns as Quantities, we recommend that you use the QTable class:
astropy.table.column.Column
astropy.units.quantity.Quantity
Challenge
- Make a table that contains three columns:
spectral type, temperature, and radius, and incude 5 rows with fake data (or real data if you like, for example from here). Try including units on the columns that can have them.
- Find the mean temperature and the maximum radius
- Try and find out how to add and remove rows
- Add a new column which gives the luminosity (using $L=4\pi R^2 \sigma T^4$)
QTable length=5
| spectral type | radius | temperature |
|---|
| solRad | K |
|---|
| str2 | float64 | float64 |
|---|
| O5 | 12.0 | 45000.0 |
| B5 | 3.9 | 15000.0 |
| A5 | 1.7 | 8200.0 |
| F5 | 1.3 | 6400.0 |
| G5 | 0.92 | 5700.0 |
Mean temperature: 16060.0 K
Maximum radius: 3.964000000000001 solRad
QTable length=5
| spectral type | radius | temperature |
|---|
| solRad | K |
|---|
| str2 | float64 | float64 |
|---|
| B5 | 3.9 | 15000.0 |
| A5 | 1.7 | 8200.0 |
| F5 | 1.3 | 6400.0 |
| G5 | 0.92 | 5700.0 |
| K5 | 0.72 | 4300.0 |
QTable length=5
| spectral type | radius | temperature | luminosity |
|---|
| solRad | K | solLum |
|---|
| str2 | float64 | float64 | float64 |
|---|
| B5 | 3.9 | 15000.0 | 693.7250235023215 |
| A5 | 1.7 | 8200.0 | 11.7718945281512 |
| F5 | 1.3 | 6400.0 | 2.554463553120115 |
| G5 | 0.92 | 5700.0 | 0.8049486705065919 |
| K5 | 0.72 | 4300.0 | 0.15967316182594046 |
Iterating over tables
It is possible to iterate over rows or over columns. To iterate over rows, simply iterate over the table itself:
  name   flux size
               cm
-------- ---- ----
source 1  1.2    1
  name   flux size
               cm
-------- ---- ----
source 2  2.2    5
  name   flux size
               cm
-------- ---- ----
source 3  3.1    4
Rows can act like dictionaries, so you can access specific columns from a row:
source 1
source 2
source 3
Iterating over columns is also easy:
  name
--------
source 1
source 2
source 3
flux
----
 1.2
 2.2
 3.1
size
 cm
----
   1
   5
   4
Accessing specific rows from a column object can also be done with the item notation:
Joining tables
Table masked=True length=3
| name | flux | size | flux2 |
|---|
| | cm | |
|---|
| str8 | float64 | int64 | int64 |
|---|
| source 1 | 1.2 | 1 | 1 |
| source 2 | 2.2 | 5 | -- |
| source 3 | 3.1 | 4 | 9 |
Masked tables
Table masked=True length=3
| name | flux |
|---|
| str8 | float64 |
|---|
| source 1 | -- |
| source 2 | 2.2 |
| source 3 | -- |
Slicing
Tables can be sliced like Numpy arrays:
Table length=3
| name | obs_date | mag_b | mag_v |
|---|
| str4 | str10 | float64 | float64 |
|---|
| M31 | 2012-01-02 | 17.1 | 17.4 |
| M101 | 2012-01-02 | 15.1 | 13.5 |
| M82 | 2012-02-14 | 16.2 | 14.5 |
Table length=4
| name | obs_date | mag_b | mag_v |
|---|
| str4 | str10 | float64 | float64 |
|---|
| M31 | 2012-01-02 | 17.0 | 17.5 |
| M31 | 2012-01-02 | 17.1 | 17.4 |
| M82 | 2012-02-14 | 16.2 | 14.5 |
| M31 | 2012-02-14 | 16.9 | 17.3 |
Table length=10
| mag_b | mag_v |
|---|
| float64 | float64 |
|---|
| 17.0 | 17.5 |
| 17.1 | 17.4 |
| 15.1 | 13.5 |
| 16.2 | 14.5 |
| 16.9 | 17.3 |
| 15.2 | 15.5 |
| 15.0 | 13.6 |
| 15.7 | 16.5 |
| 15.1 | 13.5 |
| 14.8 | 14.3 |
Challenge
Starting from the obs table:
- Make a new table that shows every other row, starting with the second row? (that is, the second, fourth, sixth, etc. rows).
- Make a new table the only contains rows where
name is M31
Table length=5
| name | obs_date | mag_b | mag_v |
|---|
| str4 | str10 | float64 | float64 |
|---|
| M31 | 2012-01-02 | 17.1 | 17.4 |
| M82 | 2012-02-14 | 16.2 | 14.5 |
| M82 | 2012-02-14 | 15.2 | 15.5 |
| M82 | 2012-03-26 | 15.7 | 16.5 |
| M101 | 2012-03-26 | 14.8 | 14.3 |
Table length=3
| name | obs_date | mag_b | mag_v |
|---|
| str4 | str10 | float64 | float64 |
|---|
| M31 | 2012-01-02 | 17.0 | 17.5 |
| M31 | 2012-01-02 | 17.1 | 17.4 |
| M31 | 2012-02-14 | 16.9 | 17.3 |
Grouping and Aggregation
Table length=10
| name | obs_date | mag_b | mag_v |
|---|
| str4 | str10 | float64 | float64 |
|---|
| M101 | 2012-01-02 | 15.1 | 13.5 |
| M101 | 2012-02-14 | 15.0 | 13.6 |
| M101 | 2012-03-26 | 15.1 | 13.5 |
| M101 | 2012-03-26 | 14.8 | 14.3 |
| M31 | 2012-01-02 | 17.0 | 17.5 |
| M31 | 2012-01-02 | 17.1 | 17.4 |
| M31 | 2012-02-14 | 16.9 | 17.3 |
| M82 | 2012-02-14 | 16.2 | 14.5 |
| M82 | 2012-02-14 | 15.2 | 15.5 |
| M82 | 2012-03-26 | 15.7 | 16.5 |
name  obs_date  mag_b mag_v
---- ---------- ----- -----
M101 2012-01-02  15.1  13.5
M101 2012-02-14  15.0  13.6
M101 2012-03-26  15.1  13.5
M101 2012-03-26  14.8  14.3

name  obs_date  mag_b mag_v
---- ---------- ----- -----
 M31 2012-01-02  17.0  17.5
 M31 2012-01-02  17.1  17.4
 M31 2012-02-14  16.9  17.3

name  obs_date  mag_b mag_v
---- ---------- ----- -----
 M82 2012-02-14  16.2  14.5
 M82 2012-02-14  15.2  15.5
 M82 2012-03-26  15.7  16.5
Table length=3
| name | mag_b | mag_v |
|---|
| str4 | float64 | float64 |
|---|
| M101 | 15.000000000000002 | 13.725000000000001 |
| M31 | 17.0 | 17.400000000000002 |
| M82 | 15.699999999999998 | 15.5 |
Writing data
Reading data
Table masked=True length=929
| ra | dec | clon | clat | err_maj | err_min | err_ang | designation | j_m | j_cmsig | j_msigcom | j_snr | h_m | h_cmsig | h_msigcom | h_snr | k_m | k_cmsig | k_msigcom | k_snr | ph_qual | rd_flg | bl_flg | cc_flg | ndet | gal_contam | mp_flg | dist | angle | j_h | h_k | j_k |
|---|
| deg | deg | | | arcsec | arcsec | deg | | mag | mag | mag | | mag | mag | mag | | mag | mag | mag | | | | | | | | | | | | | |
|---|
| float64 | float64 | str12 | str13 | float64 | float64 | int64 | str16 | float64 | float64 | float64 | float64 | float64 | float64 | float64 | float64 | float64 | float64 | float64 | float64 | str3 | str3 | str3 | str3 | str6 | int64 | int64 | float64 | float64 | float64 | float64 | float64 |
|---|
| 274.429506 | -13.870547 | 18h17m43.08s | -13d52m13.97s | 0.08 | 0.08 | 45 | 18174308-1352139 | 16.305 | 0.142 | 0.143 | 6.7 | 14.048 | 0.107 | 0.108 | 13.6 | 13.257 | 0.066 | 0.066 | 16.5 | CAA | 222 | 111 | 0ss | 066655 | 0 | 0 | 975.080151 | 256.448 | 2.257 | 0.791 | 3.048 |
| 274.423821 | -13.86974 | 18h17m41.72s | -13d52m11.06s | 0.06 | 0.06 | 90 | 18174171-1352110 | 14.802 | 0.058 | 0.059 | 26.7 | 12.635 | 0.059 | 0.06 | 50.1 | 11.768 | 0.045 | 0.046 | 65.2 | AAA | 222 | 111 | 0ss | 666666 | 0 | 0 | 993.752042 | 256.878 | 2.167 | 0.867 | 3.034 |
| 274.424587 | -13.739629 | 18h17m41.90s | -13d44m22.66s | 0.08 | 0.08 | 45 | 18174190-1344226 | 16.328 | -- | -- | -- | 14.345 | 0.059 | 0.06 | 10.4 | 13.405 | 0.046 | 0.047 | 14.4 | UAA | 022 | 011 | 0cc | 003666 | 0 | 0 | 995.726698 | 284.113 | -- | 0.94 | -- |
| 274.433933 | -13.769502 | 18h17m44.14s | -13d46m10.21s | 0.08 | 0.08 | 45 | 18174414-1346102 | 16.281 | 0.098 | 0.099 | 6.8 | 14.057 | 0.035 | 0.036 | 13.5 | 12.956 | 0.032 | 0.033 | 21.8 | CAA | 222 | 111 | 000 | 065566 | 0 | 0 | 942.627418 | 278.252 | 2.224 | 1.101 | 3.325 |
| 274.437013 | -13.885698 | 18h17m44.88s | -13d53m08.51s | 0.09 | 0.09 | 45 | 18174488-1353085 | 15.171 | -- | -- | -- | 14.412 | 0.152 | 0.152 | 9.8 | 13.742 | 0.095 | 0.095 | 10.6 | UBA | 622 | 022 | 0cc | 005566 | 0 | 0 | 964.105389 | 252.93 | -- | 0.67 | -- |
| 274.433996 | -13.752446 | 18h17m44.16s | -13d45m08.81s | 0.08 | 0.08 | 90 | 18174415-1345088 | 16.54 | -- | -- | -- | 14.519 | 0.083 | 0.083 | 8.8 | 13.604 | 0.043 | 0.044 | 12.0 | UBA | 022 | 011 | 0cc | 005666 | 0 | 0 | 953.230532 | 281.908 | -- | 0.915 | -- |
| 274.418138 | -13.77215 | 18h17m40.35s | -13d46m19.74s | 0.08 | 0.08 | 90 | 18174035-1346197 | 17.98 | -- | -- | -- | 14.61 | 0.043 | 0.044 | 8.1 | 13.456 | 0.056 | 0.057 | 13.8 | UBA | 022 | 011 | 000 | 001645 | 0 | 0 | 996.047248 | 277.25 | -- | 1.154 | -- |
| 274.433695 | -13.899049 | 18h17m44.09s | -13d53m56.58s | 0.06 | 0.06 | 90 | 18174408-1353565 | 13.011 | 0.021 | 0.024 | 139.0 | 10.917 | 0.02 | 0.021 | 243.8 | 10.013 | 0.017 | 0.019 | 328.3 | AAA | 222 | 111 | 000 | 666666 | 0 | 0 | 990.166399 | 250.466 | 2.094 | 0.904 | 2.998 |
| 274.425482 | -13.77149 | 18h17m42.12s | -13d46m17.36s | 0.08 | 0.08 | 135 | 18174211-1346173 | 16.086 | -- | -- | -- | 13.709 | 0.065 | 0.066 | 18.6 | 12.503 | 0.044 | 0.045 | 33.1 | UAA | 622 | 012 | 00c | 005555 | 0 | 0 | 970.896919 | 277.582 | -- | 1.206 | -- |
| ... | ... | ... | ... | ... | ... | ... | ... | ... | ... | ... | ... | ... | ... | ... | ... | ... | ... | ... | ... | ... | ... | ... | ... | ... | ... | ... | ... | ... | ... | ... | ... |
| 274.81801 | -14.001245 | 18h19m16.32s | -14d00m04.48s | 0.18 | 0.16 | 1 | 18191632-1400044 | 16.24 | 0.113 | 0.113 | 5.6 | 15.531 | 0.164 | 0.164 | 2.5 | 15.252 | -- | -- | -- | CDU | 220 | 110 | 000 | 060600 | 0 | 0 | 809.817146 | 149.61 | 0.709 | -- | -- |
| 274.822709 | -14.037254 | 18h19m17.45s | -14d02m14.11s | 0.07 | 0.07 | 45 | 18191745-1402141 | 15.999 | 0.097 | 0.098 | 7.0 | 14.009 | 0.032 | 0.033 | 10.0 | 13.077 | 0.035 | 0.036 | 16.4 | CAA | 222 | 111 | 000 | 062656 | 0 | 0 | 931.339773 | 152.779 | 1.99 | 0.932 | 2.922 |
| 274.880758 | -13.99956 | 18h19m31.38s | -13d59m58.42s | 0.06 | 0.06 | 90 | 18193138-1359584 | 14.163 | 0.035 | 0.037 | 37.8 | 11.179 | 0.02 | 0.021 | 135.6 | 9.765 | 0.017 | 0.019 | 347.1 | AAA | 222 | 111 | 000 | 556666 | 0 | 0 | 935.512452 | 137.762 | 2.984 | 1.414 | 4.398 |
| 274.652526 | -14.055106 | 18h18m36.61s | -14d03m18.38s | 0.06 | 0.06 | 90 | 18183660-1403183 | 15.035 | 0.052 | 0.054 | 19.4 | 13.099 | 0.04 | 0.041 | 27.5 | 12.254 | 0.041 | 0.041 | 41.7 | AAA | 222 | 111 | c00 | 566666 | 0 | 0 | 908.109808 | 190.682 | 1.936 | 0.845 | 2.781 |
| 274.760586 | -13.999927 | 18h19m02.54s | -13d59m59.74s | 0.08 | 0.08 | 90 | 18190254-1359597 | 16.329 | 0.122 | 0.123 | 5.5 | 14.488 | 0.067 | 0.067 | 6.4 | 13.617 | 0.051 | 0.052 | 11.1 | CCA | 222 | 111 | 000 | 060616 | 0 | 0 | 724.557553 | 163.227 | 1.841 | 0.871 | 2.712 |
| 274.831132 | -14.020027 | 18h19m19.47s | -14d01m12.10s | 0.08 | 0.08 | 45 | 18191947-1401120 | 16.203 | -- | -- | -- | 13.238 | 0.02 | 0.021 | 20.4 | 12.016 | 0.023 | 0.024 | 43.6 | UAA | 022 | 011 | 000 | 006666 | 0 | 0 | 891.347132 | 149.27 | -- | 1.222 | -- |
| 274.972435 | -13.760374 | 18h19m53.38s | -13d45m37.35s | 0.12 | 0.11 | 10 | 18195338-1345373 | 17.472 | -- | -- | -- | 16.755 | -- | -- | -- | 14.413 | 0.084 | 0.084 | 4.8 | UUD | 002 | 001 | 000 | 000006 | 0 | 0 | 964.828933 | 79.963 | -- | -- | -- |
| 274.870009 | -13.817775 | 18h19m28.80s | -13d49m03.99s | 0.08 | 0.08 | 45 | 18192880-1349039 | 16.933 | -- | -- | -- | 14.514 | 0.064 | 0.065 | 6.3 | 12.957 | 0.041 | 0.041 | 18.4 | UCA | 022 | 011 | 000 | 002666 | 0 | 0 | 592.998058 | 93.69 | -- | 1.557 | -- |
| 274.735323 | -13.941575 | 18h18m56.48s | -13d56m29.67s | 0.14 | 0.14 | 45 | 18185647-1356296 | 16.643 | -- | -- | -- | 14.88 | -- | -- | -- | 14.291 | 0.116 | 0.117 | 6.0 | UUC | 002 | 001 | 000 | 000004 | 0 | 0 | 498.524438 | 165.968 | -- | -- | -- |
| 274.866294 | -13.841778 | 18h19m27.91s | -13d50m30.40s | 0.08 | 0.08 | 45 | 18192791-1350304 | 15.615 | -- | -- | -- | 13.911 | 0.075 | 0.075 | 10.9 | 12.765 | 0.134 | 0.134 | 21.9 | UAE | 022 | 011 | 0cc | 005545 | 0 | 0 | 591.97725 | 102.147 | -- | 1.146 | -- |
Challenge
Using the t4 table above:
-
Make a plot that shows j_m-h_m on the x-axis, and h_m-k_m on the y-axis
-
Make a new table that contains the subset of rows where the j_snr, h_snr, and k_snr columns, which give the signal-to-noise-ratio in the J, H, and K band, are greater than 10, and try and show these points in red in the plot you just made.
-
Make a new table (based on the full table) that contains only the RA, Dec, and the j_m, h_m and k_m columns, then try and write out this catalog into a format that you can read into another software package. For example, try and write out the catalog into CSV format, then read it into a spreadsheet software package (e.g. Excel, Google Docs, Numbers, OpenOffice). You may run into an issue at this point - if so, take a look at https://github.com/astropy/astropy/issues/7357 to see how to fix it.
<matplotlib.collections.PathCollection at 0x7f696f91a630>
Table masked=True length=264
| ra | dec | clon | clat | err_maj | err_min | err_ang | designation | j_m | j_cmsig | j_msigcom | j_snr | h_m | h_cmsig | h_msigcom | h_snr | k_m | k_cmsig | k_msigcom | k_snr | ph_qual | rd_flg | bl_flg | cc_flg | ndet | gal_contam | mp_flg | dist | angle | j_h | h_k | j_k |
|---|
| deg | deg | | | arcsec | arcsec | deg | | mag | mag | mag | | mag | mag | mag | | mag | mag | mag | | | | | | | | | | | | | |
|---|
| float64 | float64 | str12 | str13 | float64 | float64 | int64 | str16 | float64 | float64 | float64 | float64 | float64 | float64 | float64 | float64 | float64 | float64 | float64 | float64 | str3 | str3 | str3 | str3 | str6 | int64 | int64 | float64 | float64 | float64 | float64 | float64 |
|---|
| 274.423821 | -13.86974 | 18h17m41.72s | -13d52m11.06s | 0.06 | 0.06 | 90 | 18174171-1352110 | 14.802 | 0.058 | 0.059 | 26.7 | 12.635 | 0.059 | 0.06 | 50.1 | 11.768 | 0.045 | 0.046 | 65.2 | AAA | 222 | 111 | 0ss | 666666 | 0 | 0 | 993.752042 | 256.878 | 2.167 | 0.867 | 3.034 |
| 274.433695 | -13.899049 | 18h17m44.09s | -13d53m56.58s | 0.06 | 0.06 | 90 | 18174408-1353565 | 13.011 | 0.021 | 0.024 | 139.0 | 10.917 | 0.02 | 0.021 | 243.8 | 10.013 | 0.017 | 0.019 | 328.3 | AAA | 222 | 111 | 000 | 666666 | 0 | 0 | 990.166399 | 250.466 | 2.094 | 0.904 | 2.998 |
| 274.431606 | -13.781877 | 18h17m43.59s | -13d46m54.76s | 0.06 | 0.06 | 45 | 18174358-1346547 | 13.87 | 0.032 | 0.034 | 63.0 | 13.406 | 0.06 | 0.061 | 24.6 | 13.365 | 0.087 | 0.088 | 15.0 | AAA | 222 | 111 | ccc | 666666 | 0 | 0 | 945.318343 | 275.508 | 0.464 | 0.041 | 0.505 |
| 274.433361 | -13.892246 | 18h17m44.01s | -13d53m32.09s | 0.06 | 0.06 | 45 | 18174400-1353320 | 15.151 | 0.059 | 0.06 | 19.4 | 13.37 | 0.064 | 0.065 | 25.5 | 12.599 | 0.048 | 0.049 | 30.3 | AAA | 222 | 111 | 000 | 566666 | 0 | 0 | 983.384329 | 251.834 | 1.781 | 0.771 | 2.552 |
| 274.427483 | -13.768612 | 18h17m42.60s | -13d46m07.00s | 0.06 | 0.06 | 90 | 18174259-1346070 | 14.423 | 0.041 | 0.043 | 37.9 | 13.926 | 0.064 | 0.065 | 15.3 | 13.744 | 0.052 | 0.053 | 10.6 | AAA | 222 | 222 | ccc | 666666 | 0 | 0 | 965.406417 | 278.247 | 0.497 | 0.182 | 0.679 |
| 274.43155 | -13.883111 | 18h17m43.57s | -13d52m59.20s | 0.06 | 0.06 | 90 | 18174357-1352591 | 15.702 | 0.084 | 0.085 | 11.7 | 13.725 | 0.091 | 0.091 | 18.4 | 12.908 | 0.069 | 0.07 | 22.8 | AAA | 222 | 222 | ccc | 266666 | 0 | 0 | 979.746164 | 253.778 | 1.977 | 0.817 | 2.794 |
| 274.432195 | -13.723433 | 18h17m43.73s | -13d43m24.36s | 0.06 | 0.06 | 90 | 18174372-1343243 | 13.843 | 0.019 | 0.023 | 64.6 | 11.363 | 0.02 | 0.021 | 161.7 | 10.243 | 0.019 | 0.021 | 265.6 | AAA | 222 | 111 | 000 | 666666 | 0 | 0 | 986.230333 | 287.779 | 2.48 | 1.12 | 3.6 |
| 274.429849 | -13.838672 | 18h17m43.16s | -13d50m19.22s | 0.06 | 0.06 | 45 | 18174316-1350192 | 15.726 | 0.069 | 0.07 | 11.4 | 13.911 | 0.053 | 0.053 | 15.5 | 13.025 | 0.069 | 0.07 | 20.5 | AAA | 222 | 111 | c00 | 166666 | 0 | 0 | 953.670451 | 263.151 | 1.815 | 0.886 | 2.701 |
| 274.427993 | -13.829856 | 18h17m42.72s | -13d49m47.48s | 0.06 | 0.06 | 90 | 18174271-1349474 | 13.307 | 0.029 | 0.032 | 105.8 | 12.919 | 0.063 | 0.063 | 38.6 | 12.795 | 0.065 | 0.065 | 25.3 | AEA | 222 | 212 | c0c | 665566 | 0 | 0 | 956.908469 | 265.084 | 0.388 | 0.124 | 0.512 |
| ... | ... | ... | ... | ... | ... | ... | ... | ... | ... | ... | ... | ... | ... | ... | ... | ... | ... | ... | ... | ... | ... | ... | ... | ... | ... | ... | ... | ... | ... | ... | ... |
| 274.788401 | -13.953847 | 18h19m09.22s | -13d57m13.85s | 0.06 | 0.06 | 90 | 18190921-1357138 | 14.991 | 0.041 | 0.043 | 18.9 | 12.716 | 0.036 | 0.037 | 32.9 | 11.688 | 0.024 | 0.026 | 65.5 | AAA | 222 | 111 | ccc | 666655 | 0 | 0 | 610.307615 | 149.875 | 2.275 | 1.028 | 3.303 |
| 274.797491 | -14.066624 | 18h19m11.40s | -14d03m59.85s | 0.06 | 0.06 | 90 | 18191139-1403598 | 13.965 | 0.036 | 0.038 | 48.6 | 13.019 | 0.053 | 0.053 | 24.9 | 12.61 | 0.042 | 0.043 | 28.0 | AAA | 222 | 111 | 000 | 555566 | 0 | 0 | 993.135358 | 160.109 | 0.946 | 0.409 | 1.355 |
| 274.804877 | -13.91268 | 18h19m13.17s | -13d54m45.65s | 0.06 | 0.06 | 45 | 18191317-1354456 | 14.356 | 0.035 | 0.037 | 33.9 | 13.504 | 0.055 | 0.056 | 15.9 | 13.273 | 0.049 | 0.05 | 15.2 | AAA | 222 | 111 | 000 | 666656 | 0 | 0 | 525.943465 | 136.214 | 0.852 | 0.231 | 1.083 |
| 274.900945 | -13.903238 | 18h19m36.23s | -13d54m11.66s | 0.06 | 0.06 | 90 | 18193622-1354116 | 12.454 | 0.028 | 0.03 | 182.3 | 11.81 | 0.03 | 0.031 | 75.8 | 11.36 | 0.024 | 0.026 | 79.9 | AAA | 222 | 111 | 000 | 556655 | 0 | 0 | 780.501247 | 116.308 | 0.644 | 0.45 | 1.094 |
| 274.836101 | -14.037536 | 18h19m20.66s | -14d02m15.13s | 0.06 | 0.06 | 45 | 18192066-1402151 | 15.217 | 0.061 | 0.062 | 14.3 | 13.358 | 0.062 | 0.062 | 18.2 | 12.489 | 0.051 | 0.052 | 28.2 | AAA | 222 | 111 | 000 | 266666 | 0 | 0 | 954.544823 | 150.31 | 1.859 | 0.869 | 2.728 |
| 274.862392 | -13.84573 | 18h19m26.97s | -13d50m44.63s | 0.06 | 0.06 | 90 | 18192697-1350446 | 14.369 | 0.041 | 0.043 | 31.2 | 12.46 | 0.03 | 0.031 | 41.7 | 11.561 | 0.026 | 0.027 | 66.4 | AAA | 222 | 111 | 000 | 666633 | 0 | 0 | 581.867714 | 103.799 | 1.909 | 0.899 | 2.808 |
| 274.858201 | -13.918294 | 18h19m25.97s | -13d55m05.86s | 0.06 | 0.06 | 45 | 18192596-1355058 | 14.156 | 0.052 | 0.054 | 38.0 | 12.13 | 0.051 | 0.052 | 56.5 | 11.215 | 0.037 | 0.038 | 91.3 | AAA | 222 | 111 | ccc | 666666 | 0 | 0 | 680.283673 | 126.015 | 2.026 | 0.915 | 2.941 |
| 274.611341 | -14.056347 | 18h18m26.72s | -14d03m22.85s | 0.06 | 0.06 | 90 | 18182672-1403228 | 15.066 | 0.07 | 0.071 | 18.9 | 13.367 | 0.091 | 0.091 | 21.5 | 12.634 | 0.065 | 0.065 | 29.4 | AAA | 222 | 111 | ccc | 666666 | 0 | 0 | 949.652829 | 199.19 | 1.699 | 0.733 | 2.432 |
| 274.880758 | -13.99956 | 18h19m31.38s | -13d59m58.42s | 0.06 | 0.06 | 90 | 18193138-1359584 | 14.163 | 0.035 | 0.037 | 37.8 | 11.179 | 0.02 | 0.021 | 135.6 | 9.765 | 0.017 | 0.019 | 347.1 | AAA | 222 | 111 | 000 | 556666 | 0 | 0 | 935.512452 | 137.762 | 2.984 | 1.414 | 4.398 |
| 274.652526 | -14.055106 | 18h18m36.61s | -14d03m18.38s | 0.06 | 0.06 | 90 | 18183660-1403183 | 15.035 | 0.052 | 0.054 | 19.4 | 13.099 | 0.04 | 0.041 | 27.5 | 12.254 | 0.041 | 0.041 | 41.7 | AAA | 222 | 111 | c00 | 566666 | 0 | 0 | 908.109808 | 190.682 | 1.936 | 0.845 | 2.781 |
<matplotlib.collections.PathCollection at 0x7f696f80ac18>
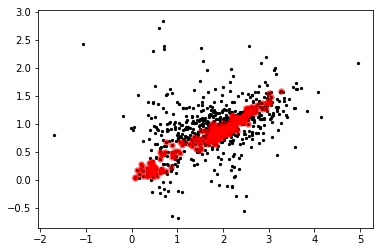
Table masked=True length=929
| ra | dec | j_m | h_m | k_m |
|---|
| deg | deg | mag | mag | mag |
|---|
| float64 | float64 | float64 | float64 | float64 |
|---|
| 274.429506 | -13.870547 | 16.305 | 14.048 | 13.257 |
| 274.423821 | -13.86974 | 14.802 | 12.635 | 11.768 |
| 274.424587 | -13.739629 | 16.328 | 14.345 | 13.405 |
| 274.433933 | -13.769502 | 16.281 | 14.057 | 12.956 |
| 274.437013 | -13.885698 | 15.171 | 14.412 | 13.742 |
| 274.433996 | -13.752446 | 16.54 | 14.519 | 13.604 |
| 274.418138 | -13.77215 | 17.98 | 14.61 | 13.456 |
| 274.433695 | -13.899049 | 13.011 | 10.917 | 10.013 |
| 274.425482 | -13.77149 | 16.086 | 13.709 | 12.503 |
| ... | ... | ... | ... | ... |
| 274.81801 | -14.001245 | 16.24 | 15.531 | 15.252 |
| 274.822709 | -14.037254 | 15.999 | 14.009 | 13.077 |
| 274.880758 | -13.99956 | 14.163 | 11.179 | 9.765 |
| 274.652526 | -14.055106 | 15.035 | 13.099 | 12.254 |
| 274.760586 | -13.999927 | 16.329 | 14.488 | 13.617 |
| 274.831132 | -14.020027 | 16.203 | 13.238 | 12.016 |
| 274.972435 | -13.760374 | 17.472 | 16.755 | 14.413 |
| 274.870009 | -13.817775 | 16.933 | 14.514 | 12.957 |
| 274.735323 | -13.941575 | 16.643 | 14.88 | 14.291 |
| 274.866294 | -13.841778 | 15.615 | 13.911 | 12.765 |